Figure 1.
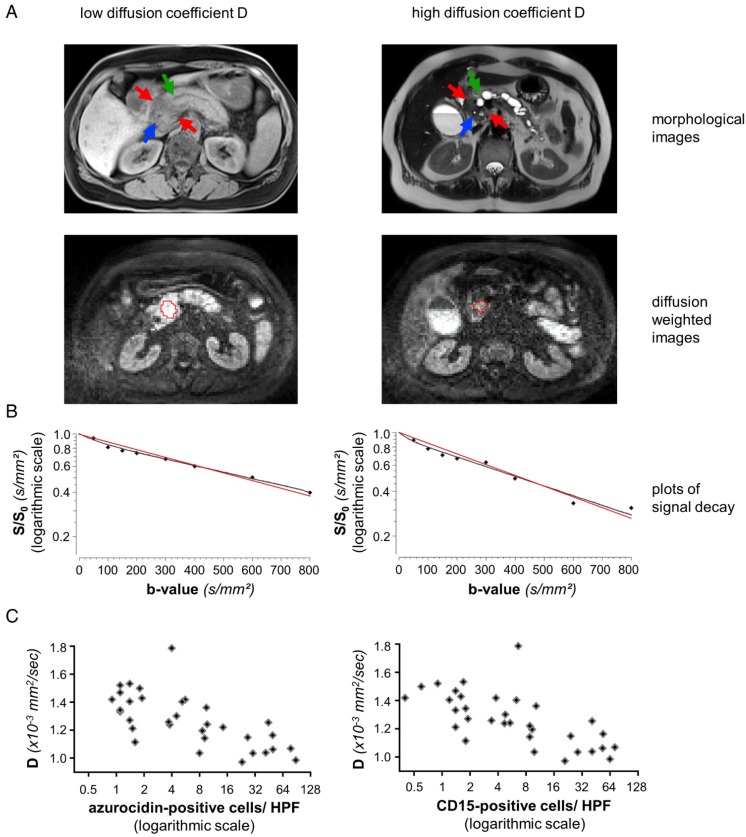
Representative data from two patients, one with high, one with low number of PMN: (A) MRI images of a representative patient with low diffusion constant D (patient number 3 from Table 1, left column) and a representative patient with high D (patient number 31 from Table 1, right column). The morphological images (axial native T1 VIBE fat saturated and T2 HASTE) show upstream dilatation of the main pancreatic ducts (green arrows) due to obstructing tumors in the pancreatic heads (red arrows). Stents in the distal common bile ducts which are not dilated (blue arrows). Diffusion-weighted MR images (b=600) caudad to the morphological images with the freehand VOIs (red). (B) Representative plots of signal decay and calculated DWI parameters for reader 1. Biexponential IVIM fits are in black, monoexponential fits (ADCall) are in red. Calculated D and ADCall values for reader 1 were 1.02 × 10⁻³ mm2/sec and 1.12 × 10⁻³ mm2/sec for patient number 3 (left) and 1.51 × 10⁻³ mm2/sec and 1.65 × 10⁻³ mm2/sec for patient number 31 (right). (C): Dependency of the structural diffusion coefficient D on the number of azurocidin-positive cells per HPF or on the number of CD15-positive cells per HPF. Abbreviations: D: structural diffusion coefficient; HPF: high power field; S: signal with diffusion weighting; S0: signal without diffusion weighting.

