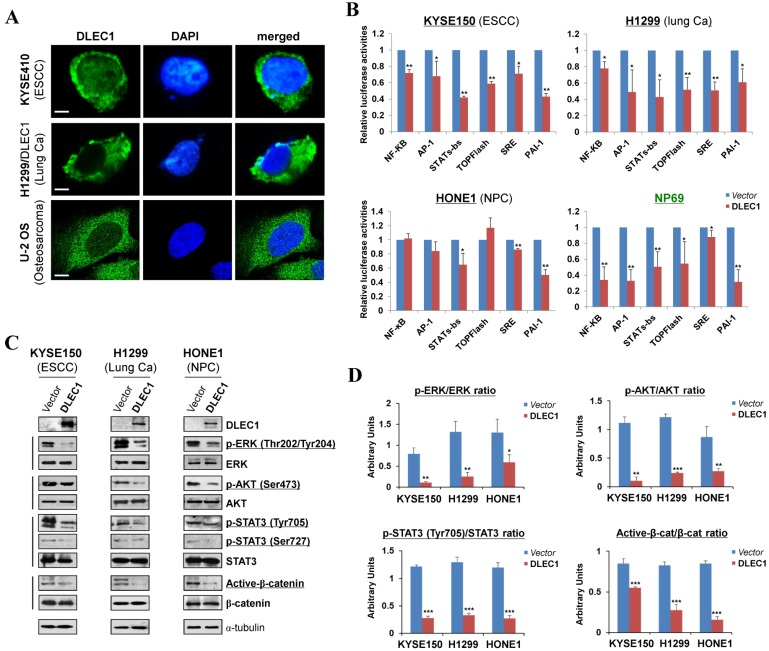
Figure 5.
DLEC1 as a cytoplasmic protein regulates multiple cell signaling pathways. (A) Subcellular localization of DLEC1 (green) in cell cytoplasm of carcinoma cells. DAPI counterstaining (blue) was used to visualize nuclear DNA. Images of osteosarcoma cell line U-2 OS were retrieved from Human Protein Atlas database. Original magnification, ×400. Scale bar 10 μm. (B) Promoter luciferase activities of NF-κB, AP-1, STATs-bs, TopFlash, SRE and PAI-1 reporters were normalized to the values of Renilla luciferase activity in tumor and immortalized normal cell lines. Results are expressed as fold reduction of activity and shown as means ± SD of three independent experiments performed in triplicate. *p < 0.05, **p < 0.01. (C) DLEC1 inhibited the phosphorylation levels of ERK, AKT and STAT3. Western blot was used to examine protein levels of total ERK, p-ERK (Thr202/Tyr204), total AKT, p-AKT(ser473), total STAT3, p-STAT3 (Tyr705, Ser727), total β-catenin and active β-catenin in DLEC1-expressing multiple carcinoma cells. (D) Results are expressed as ratio between phosphorylated/activated (p-ERK, p-AKT, p-STAT3 (Tyr705), Active-β-catenin) and non-phosphorylated/total (ERK, AKT, STAT3, β-catenin) forms. Three different experiments were performed and data are expressed as mean ± SD. *p < 0.05, **p < 0.01, ***p < 0.001.

