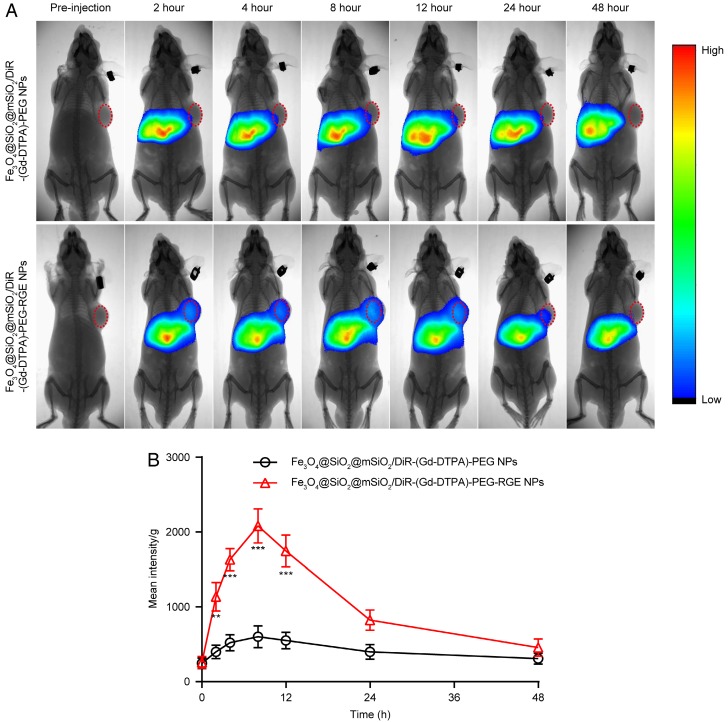
Figure 4.
(A) In vivo fluorescent imaging of Fe3O4@SiO2@mSiO2/DiR-(Gd-DTPA)-PEG NPs and Fe3O4@SiO2@mSiO2/DiR-(Gd-DTPA)-PEG-RGE NPs on small U87MG tumor-bearing mice (n = 3) following i.v. administration of NPs at different time points. Color bar on the right side indicates the signal intensity of the fluorescence. (B) The pharmacokinetic profile of DiR in tumor tissue based on the semi-quantitative ROI analysis of in vivo fluorescent images.

