Figure 2.
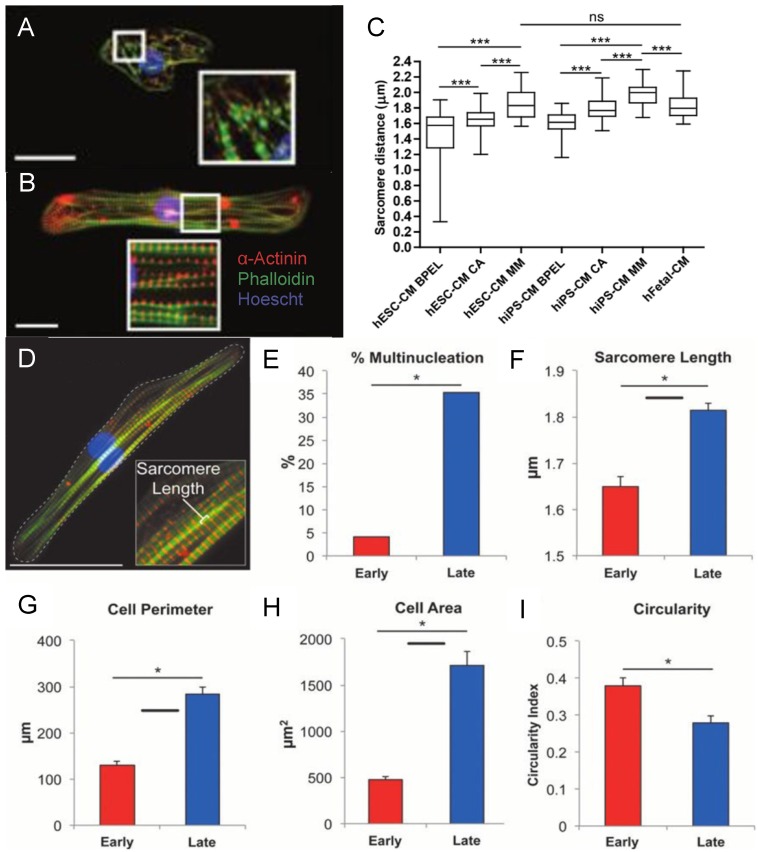
Fluorescence image of (A) early stage PSC-CM (day ~30) and (B) late stage PSC-CM (day ~100). Stained for α-actinin and phalloidin, indicating an increase in sarcomeric organization and myofibril density with increased time in culture. Scale bar 25 μm 81. Reproduced with permission from John Wiley and Sons. (C) Median, maximum, and minimum sarcomere distance of human fetal cardiomyocytes (hFetal-CM), and hiPSC-CM and hESC-CM in standard BPEL media, cardiomyocyte media (CA), and maturation media (MM). ns = non-significant; *P < 0.05; **P < 0.01; ***P < 0.001 47. Reproduced with permission from Elsevier. (D) Late stage PSC-CM (day ~100) were fixed, stained, and imaged using fluorescence microscopy then compared to early stage PSC-CM (day ~30) for (E) %multinucleation, (F) sarcomere length, (G) cell perimeter, (H) cell area, and (I) circularity 81. Reproduced with permission from John Wiley and Sons.

