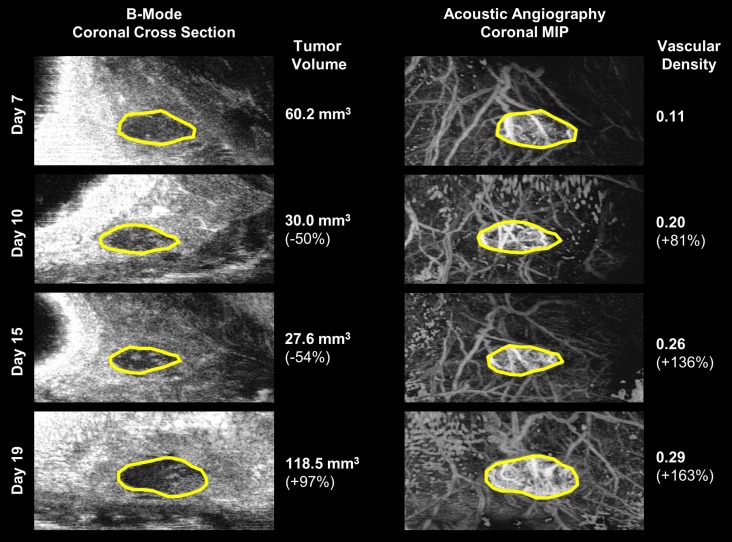
Figure 6.
A visual comparison of vascular density and tumor volume changes during the tumor regrowth phase of the same 15 Gy local failure tumor plotted in Figure 4. Vascular density (right) noticeably increases from day 7 to day 19, while tumor volume (left) size continues to decrease until day 19. The tumor boundary in the b-mode images is indicated by the solid yellow line. Note that microvascular data is shown as a maximum intensity projection but is actually a 3-D data set.

