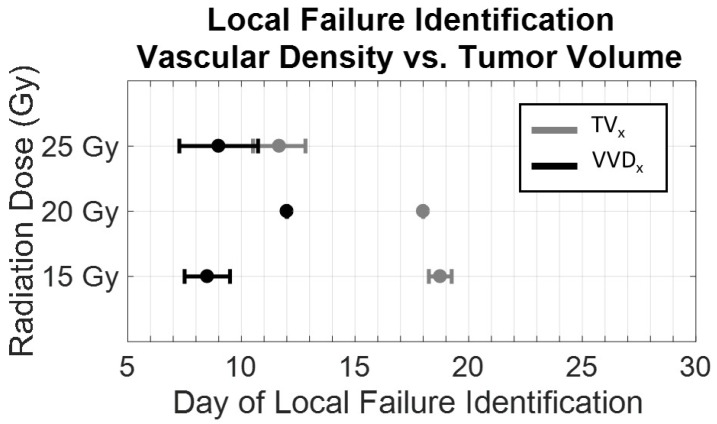
Figure 7.
Dose dependence of the early detection of treatment failure by tumor vascular density. Local failure identification using vascular density (black) occurred earlier than using tumor volume (gray). With increasing dose, the difference in the time of identification between vascular density and tumor volume decreased. ([*] significant at p < 0.05).

