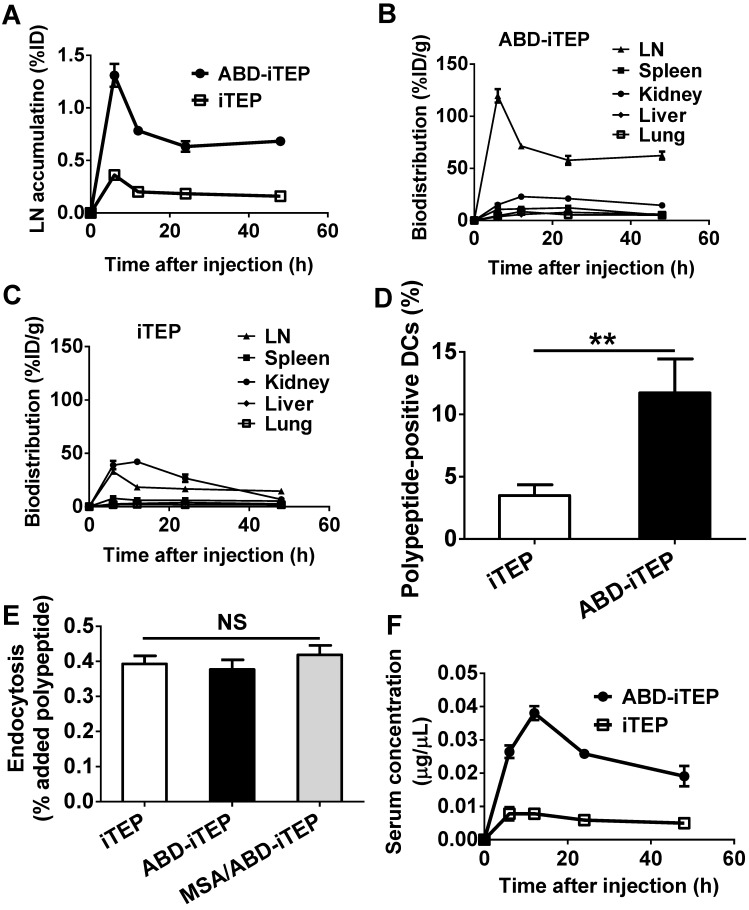
Figure 2.
The biodistribution and pharmacokinetics of ABD-iTEP. (A) LN accumulation of ABD-iTEP and iTEP. The data are expressed as percentage of injected dose, %ID, (N=3). Biodistribution of (B) ABD-iTEP and (C) iTEP in various organs. The data were expressed as percentage of injected dose per gram of tissue mass, %ID/g, (N=3). (D) The percentage of DCs in LNs that internalized iTEP or ABD-iTEP. DCs that internalized iTEP or ABD-iTEP (Alexa Fluor 488 positive) were quantified by flow cytometry, (N=3). (E) In vitro uptake of iTEP, ABD-iTEP and MSA/ABD-iTEP by DCs. DC2.4 cells were incubated with iTEP, ABD-iTEP or MSA/ABD-iTEP for 2 h before the analysis. The experiment was performed in triplicate. (F) The serum concentration of ABD-iTEP and iTEP, (N=3). All data in this figure are shown as mean ± standard error of the mean (SEM). Data in (D) was analyzed by Student's t test, data in (E) was analyzed by one-way ANOVA with Bonferroni post-test, **P < 0.01, NS = not significant.

