Figure 2.
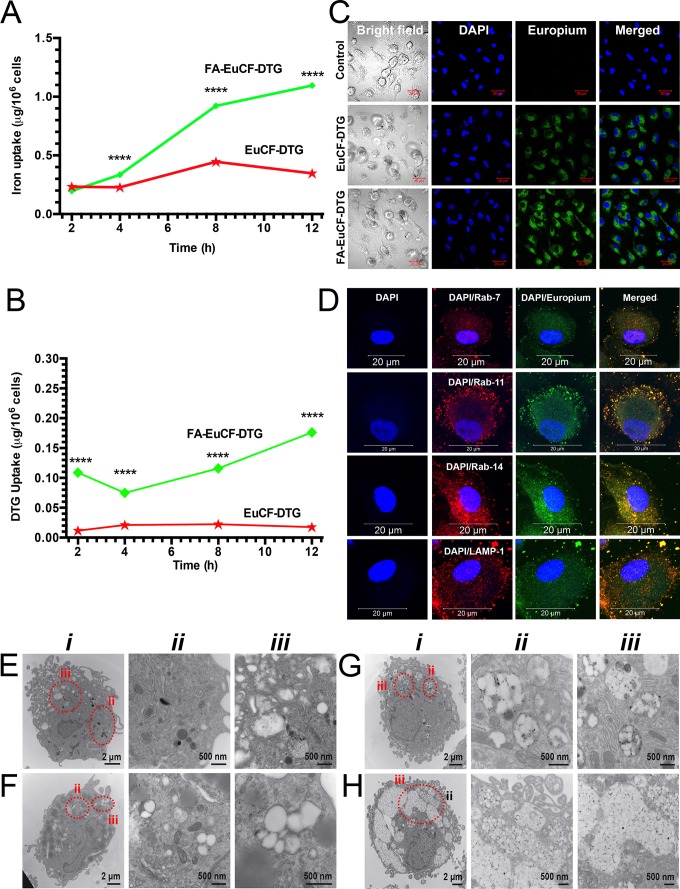
Macrophage nanoparticle uptake and subcellular distribution. Uptake and subcellular distribution of nanoparticles was determined in human MDM (monocyte-derived macrophage). EuCF-DTG and FA-EuCF-DTG nanoparticles were detected in cells at 2 h. EuCF-DTG and FA-EuCF-DTG nanoparticles were added to MDM culture at a concentration of 5 μg/mL iron (cytotoxicity tests available in Figure S6). (A) Iron concentrations in MDM following nanoparticle uptake over 12 h and (B) corresponding DTG levels; data represent mean ± SEM (n = 3). Statistical differences were determined using one-way ANOVA among groups followed by Student's t-test for differences between groups at each time-point, ****p < 0.0001. (C) Intracellular nanoparticles were detected by confocal microscopy at an excitation wavelength of 488 nm and emission wavelength of 510/520 nm (see Figure S7 for time-dependent uptake of nanoparticles). (D) For subcellular distribution analysis, MDM were treated with EuCF-DTG nanoparticles (5 μg/mL based on iron; green) for 8 h and then immunostained with Rab7, Rab11, Rab14 and LAMP-1 antibodies and Alexa Fluor 594-labeled secondary antibody (red) to visualize nanoparticle and organelle co-registration. The yellow (merged) shows overlap of nanoparticles and Rab compartments. DAPI (blue) stain indicates cell nuclei. Images were captured with 63X objective on a Zeiss LSM 710 confocal microscope. Scale bars = 20 µm (low-power images are available in Figure S8). (E-H) TEM ultrastructural evaluation of macrophage nanoparticle uptake and subcellular distribution. Nanoparticles were added to MDM cultures for 8 h. Cells were fixed and processed for TEM. (E) Typical internal morphology of control macrophages is shown. Detailed evaluation of membrane-bound intracellular structures at areas of interest is presented in magnified panel ii and iii. (F-H) Intracellular uptake of (F) PCL-DTG (without EuCF), (G) EuCF-DTG and (H) FA-EuCF-DTG nanoparticles. Areas of interest bordered with dotted red lines are presented in corresponding high-resolution images (ii-iii) and illustrate nanoparticles within membrane-bound intracellular structures. All nanoparticle types were internalized and entrapped in endosomal vesicles in the macrophages. Images of macrophages treated with FA-functionalized nanoparticles reveal a higher number of nanoparticles internalized in vesicles compared to non-decorated particles. EuCF-DTG and FA-EuCF-DTG nanoparticles are seen as black punctate structures encapsulated in white polymeric nanoparticles within membrane-bound endosomes (Figure 2G-H and Figure S4 show surface morphology by SEM of cells after nanoparticle treatment).

