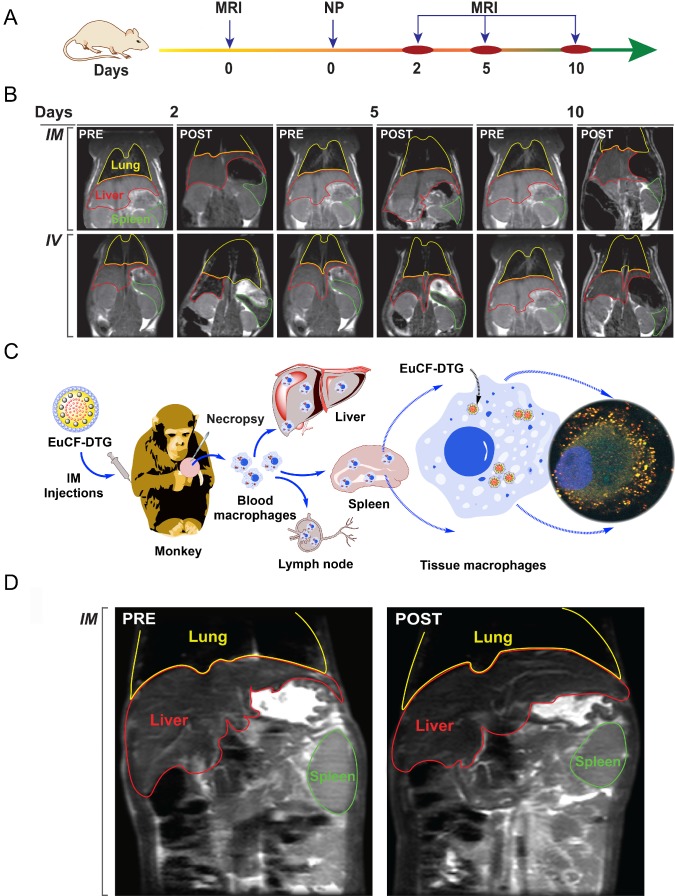
Figure 4.
Nanoparticle biodistribution tests. (A) Time line of the experimental procedure in the rats is shown (NP: nanoparticles). (B) Representative T2 maps of rats at 2, 5 and 10 days after IV or IM administration of 2 mg iron/kg as EuCF-DTG nanoparticles (yellow: lung; red: liver; green: spleen). (C) Schematic diagram of macrophage-based biodistribution of EuCF-DTG nanoparticles in the reticuloendothelial system of rhesus macaques (IM: intramuscular). (D) Representative T2-weighted images of a macaque at 5 days after IM administration of 2 mg iron/kg as EuCF-DTG nanoparticles (yellow: lung; red: liver; green: spleen). (FA-EuCF-DTG nanoparticle biodistribution in rats by MRI test is shown in Figure S9-10).

