Figure 7.
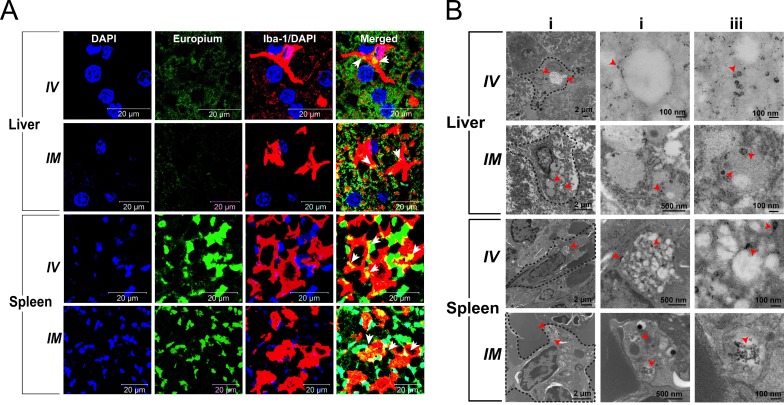
Immunohistochemical and morphological localization of EuCF-DTG nanoparticles. (A) Representative tissue sections of liver and spleen of rats administered EuCF-DTG nanoparticles (green) were stained for Iba-1 (red) on activated macrophages. Nanoparticles were detected in macrophages in both liver and spleen. Arrows in the merged figures indicate co-localization of nanoparticles in macrophages. Images were captured with 63X objective on a Zeiss LSM 710 confocal microscope. (B) TEM of liver and spleen 5 days after IV or IM injection of EuCF-DTG nanoparticles (2 mg iron/kg). Panels ii and iii are higher-powered images from regions indicated by red arrowheads in panel i. Presence of nanoparticles (black dots) is seen in macrophages in both liver and spleen (panel ii and iii, Figure S11. FA-EuCF-DTG nanoparticles were seen localization in reticuloendothelial tissues by TEM tests.

