Figure 2.
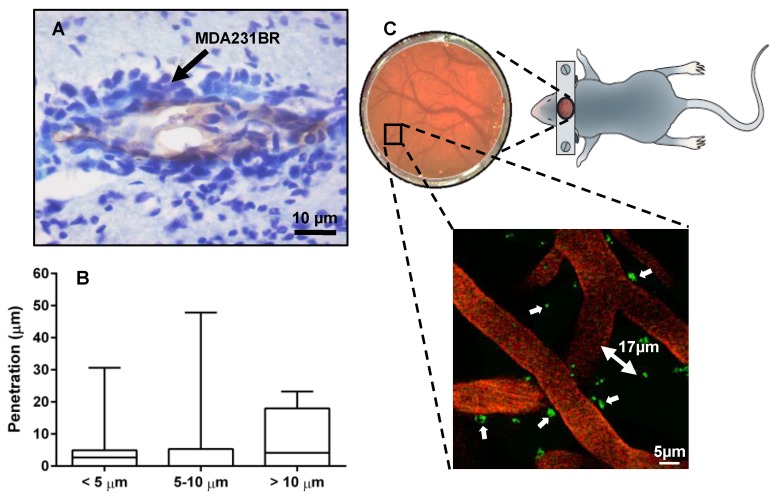
(A) Immunohistochemical detection of brain metastases. Photomicrograph of tumor colonies showing co-localization of VCAM-1 (brown) with brain metastasis (violet) at day 21 after intra-cardiac injection of MDA231BR cells. (B) Summary statistics of the depth of penetration of cancer cells for vessels of different diameters. Box and whiskers plots of minimum to maximum values, showing the median and SD at each vessel diameter grouping. (C) 2-Photon microscopy of brain parenchyma and vessels (seen through viewing window) showing co-optive growth (white arrows) of GFP MDA231BR cells (green) around vessels (orange - TRITC) with maximal penetration from the vessel lumen in this slice, 17 μm.

