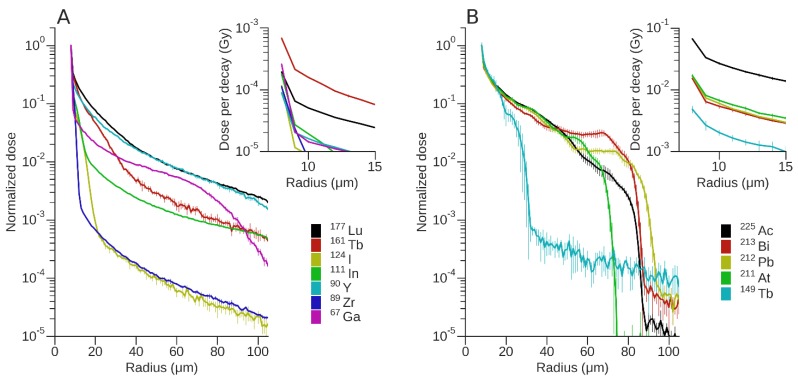
Figure 3.
Absorbed dose profiles of each radionuclide for a vessel of 15 μm radius and length of 40 μm. Dose was normalised to the first bin with bin width set at 1 μm. Data points represent the average and SD of 5 runs. Absorbed dose profiles for (A) AE and β-emitting radionuclides and (B) α-emitting radionuclides. Insets show the non-normalized dose (in Gy) per event.

