
Figure 1.
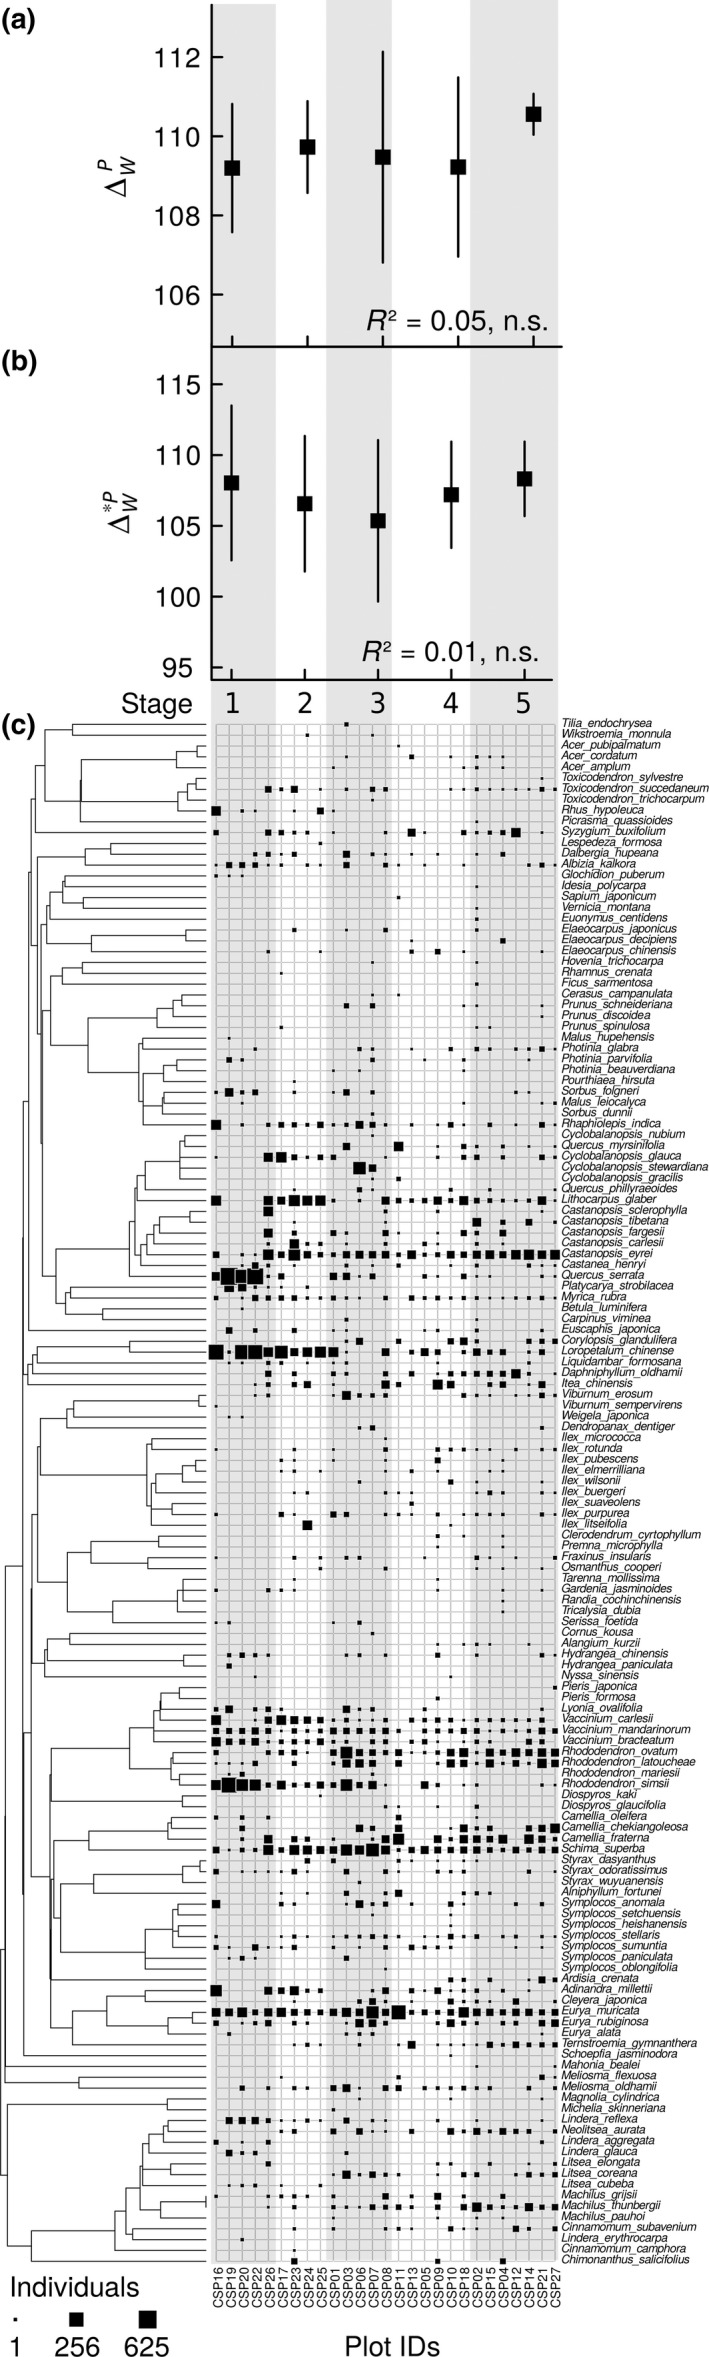
Phylogenetic alpha diversity within the five successional stages (mean ± 1 SE; Stage 1 (<20 years): n = 5, Stage 2 (20–39 years): n = 4, Stage 3 (40–59 years): n = 5, Stage 4 (60–79 years): n = 6, Stage 5 (≥80 years): n = 7), based on (a) presence/absence (ΔP w) and (b) abundance data (Δ*P w). ΔP w and Δ*P w are equivalent to the mean phylogenetic distance between distinct species (ΔP w), and the mean phylogenetic distance between individuals of distinct species (Δ*P w) within communities, respectively. R 2 values are given. None of the two alpha diversity measures showed a significant successional trend. (c) Distribution of abundances within the 27 comparative study plots [assigned to one of the five successional stages (Stage 1–5)] mapped onto the phylogeny of the 143 species. The size of the black squares corresponds to the number of individuals