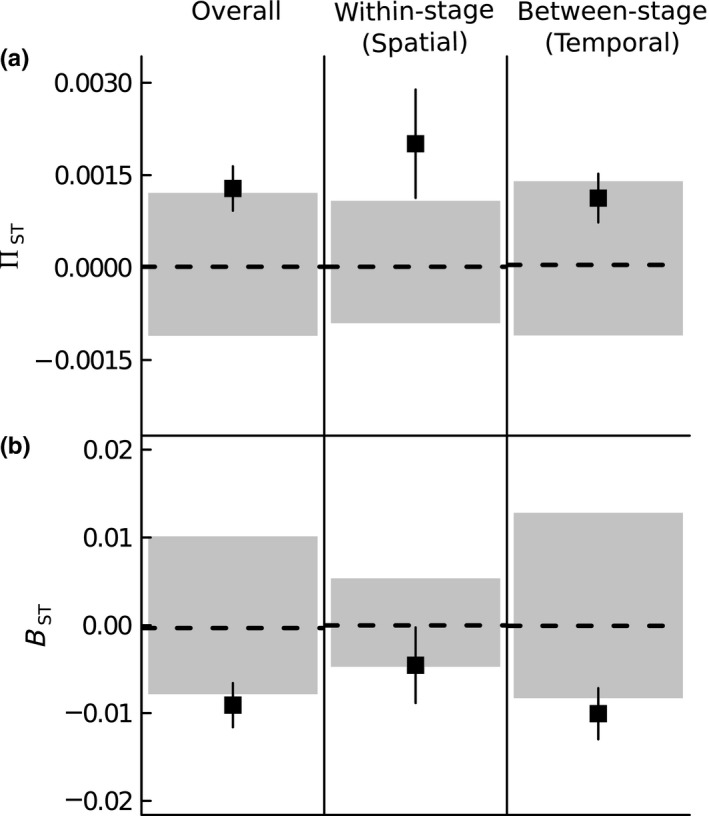
Figure 2.

Phylogenetic turnover for all pairs of plots (combining spatial and temporal turnover, n = 351, left panel) dissected into spatial, i.e. within‐successional stage, (n = 62, middle panel) and temporal, i.e. between‐stage, (n = 289, right panel) turnover (black squares, mean ± 1 SE). Phylogenetic turnover was calculated for (a) presence/absence (ΠST) and (b) abundance data (BST) and is based on the partitioning of the mean phylogenetic distance between distinct species, or between individuals of distinct species, into within‐ and between‐community components. ΠST, or BST, > 0 indicate that the species, or individuals, co‐occurring within communities are phylogenetically more related to each other than to species from other communities (high turnover). BST, or ΠST, < 0 indicate that the species, or individuals, co‐occurring within communities are phylogenetically less related to each other than to species from other communities (low turnover). The black‐dashed line and gray‐shaded area represent the mean and the 95% CI, respectively, from the 999 random communities. BST and ΠST values outside the interval indicate nonrandom phylogenetic turnover
