
Figure 3.
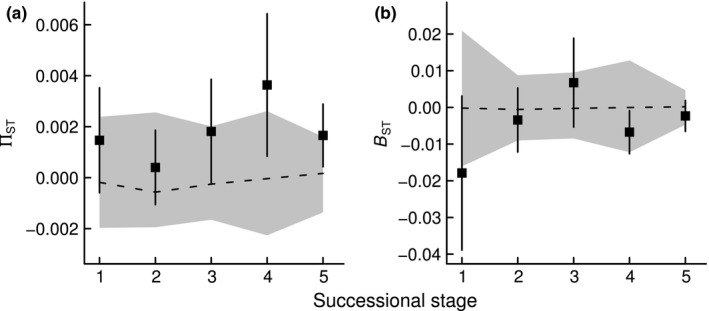
Spatial phylogenetic turnover between all pairs of communities within each of the five successional stages (black squares, mean ± 1 SE; Stage 1: n = 10, Stage 2: n = 6, Stage 3: n = 10, Stage 4: n = 15, Stage 5: n = 21), based on (a) presence/absence (ΠST) and (b) abundance data (BST). BST or ΠST values above (or below) the gray‐shaded area (i.e., the 95% CI for the BST or ΠST values from the 999 random communities) indicate spatial phylogenetic clustering (or overdispersion)