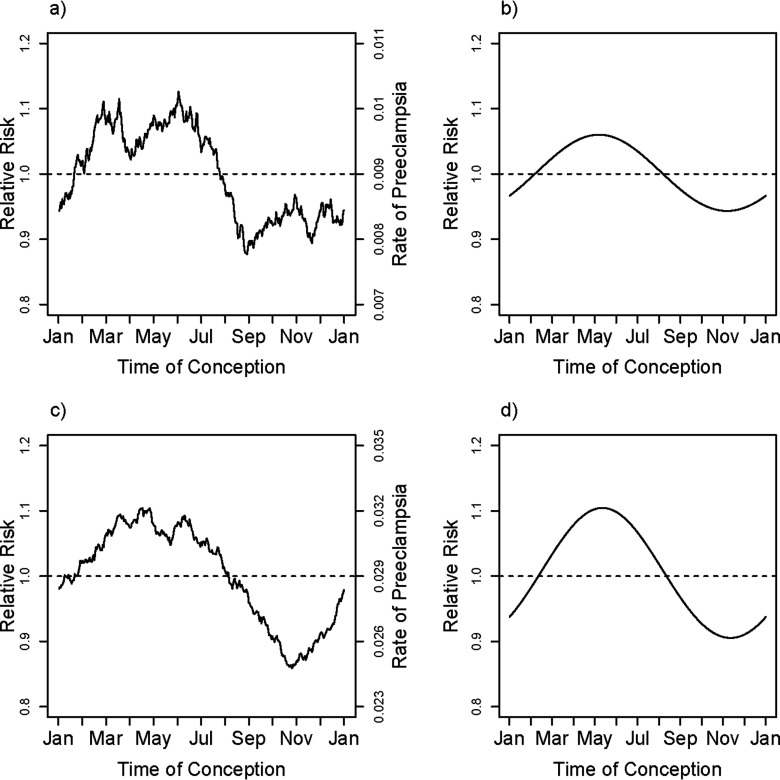
Figure 6.
Unadjusted smoothed rates and fitted adjusted relative rates of PE for birth before and birth after 37 wk gestation in Norway. The smoothed curve in (a), and (c) is based on a moving average of outcomes that uses a window encompassing from each day of the year, thus estimating the fraction with PE among pregnancies conceived at each day of the year. The fitted relative rates shown in (b), and (d) are based on the first harmonic (sine and cosine) fit separately to each of the two gestational ages, gestational , and gestational , with models that are adjusted for the covariates maternal age, maternal age squared, education, primiparity, smoking (in three categories), marital status, region (in three categories) and interaction between primiparity and region. The curve shown is based on entering the preterm-category–specific mean for all covariates, centering the estimated log hazard ratio and then exponentiating it.

