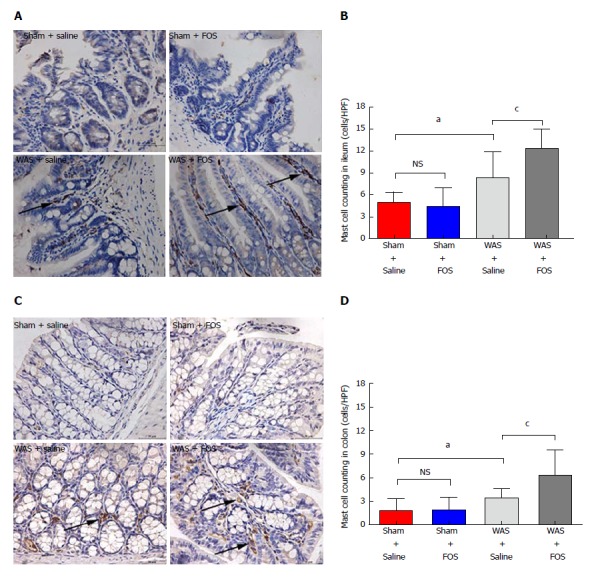
Figure 6.

Effect of oral gavage of fructo-oligosaccharide on the number of mucosal mast cells (arrows). A: Ileal tissues stained with mast cell tryptase (magnification, 400 ×); B: In saline administered mice, mast cell counts increased in WAS compared to the sham-WAS group. Mast cell counts increased in FOS compared to saline administered mice following WAS; C: Colon stained with mast cell tryptase (magnification, 400 ×); D: In saline-administered mice, mast cell count increased in the WAS group compared to the sham-WAS group. Mast cell count increased in FOS compared to saline-administered mice following WAS. Values represent mean ± SD; sham + saline (n = 7), sham + FOS (n = 7), WAS + saline (n = 6), WAS + FOS (n = 7); one-way ANOVA. aP < 0.05, sham + saline vs WAS + saline; cP < 0.05, WAS + saline vs WAS + FOS. FOS: Fructo-oligosaccharide; WAS: Water avoidance stress.
