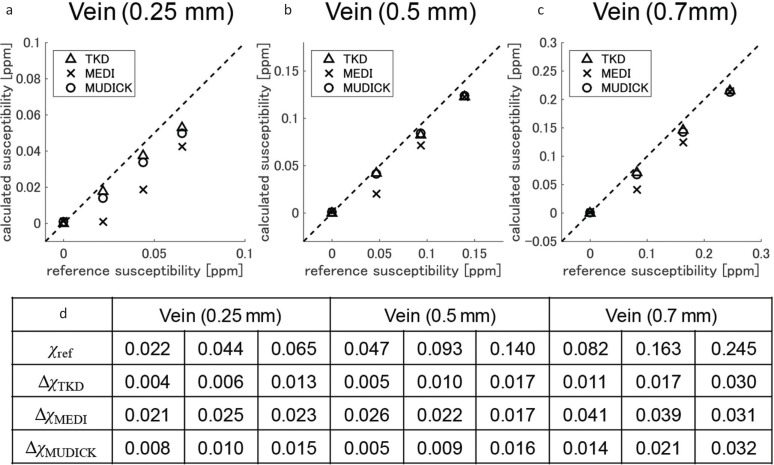
Fig 6.
Comparison of estimation accuracy in small veins between the conventional and proposed methods. (a–c) Plots of mean susceptibilities in regions of interest (ROIs) of reference and calculated susceptibility maps. ROIs are set in small veins with diameters of (a) 0.25 mm, (b) 0.5 mm, and (c) 0.7 mm. Mean susceptibilities in brain ROI are also plotted in (a–c). Dashed lines in (a–c) indicate the lines of y = x. Note that the values of reference susceptibilities are untrue values that include partial volume effects. (d) Comparison of calculation errors in small veins. χref denotes mean susceptibilities in ROIs of reference map. ΔχTKD, ΔχMEDI, and ΔχMUDICK denote calculation errors of TKD, MEDI, and MUDICK, respectively. Calculation errors are defined as the absolute difference between mean susceptibilities of reference and calculated susceptibility maps. MEDI, morphology enabled dipole inversion; MUDICK, multiple dipole-inversion combination with k-space segmentation; TKD, thresholdbased k-space division.

