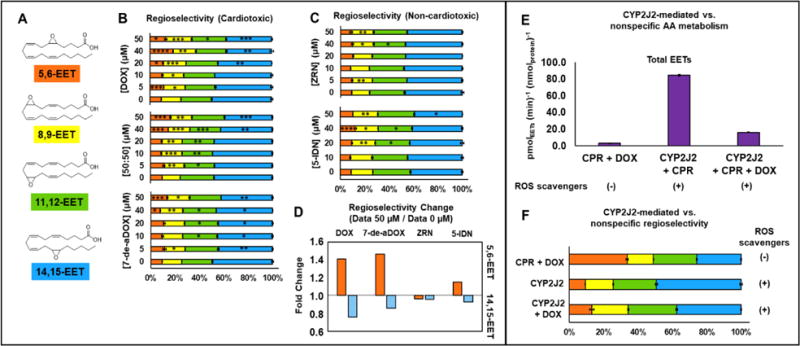
Figure 3.

Regioselectivity of the epoxidation of AA by CYP2J2 in the presence of anthracyclines. (A) EET regioisomers. (B) Regioselectivity of EETs in the presence of DOX, 7-de-aDOX, and the 50:50 mixture of DOX:7-de-aDOX. Each EET is shown as a percentage of the total EETs. The colors of the bars represent the colors associated with EETs in panel (A). (C) Regioselectivity of epoxidation in the presence of ZRN and 5-IDN. (D) Fold-change of the regioselectivity for 5,6-EET and 14,15-EET of the data in Panels (B) and (C). Fold change = (Percent of regioisomer in the presence of 50 μM anthracycline) / (Percent of regioisomer in the presence of 0 μM anthracycline). Data presented in (A-D) is obtained from the same dataset as presented in Figure 2. (E) Rate of epoxidation of AA by CYP2J2 and/or CPR in presence and absence of ROS scavengers. Rates are normalized to the amount of CPR (0.3 nmol) or CYP2J2 (0.3 nmol). (F) Regioselectivity of epoxidation by CYP2J2 vs. nonspecific epoxidation. In all these experiments 50 μM DOX and 100 μM of AA was used. Concentrations of anthracyclines represent the total amount of anthracyclines present. Error represents the SEM of 3 experiments. P values: * < 0.05; ** < 0.01; *** < 0.001; **** < 0.0001.
