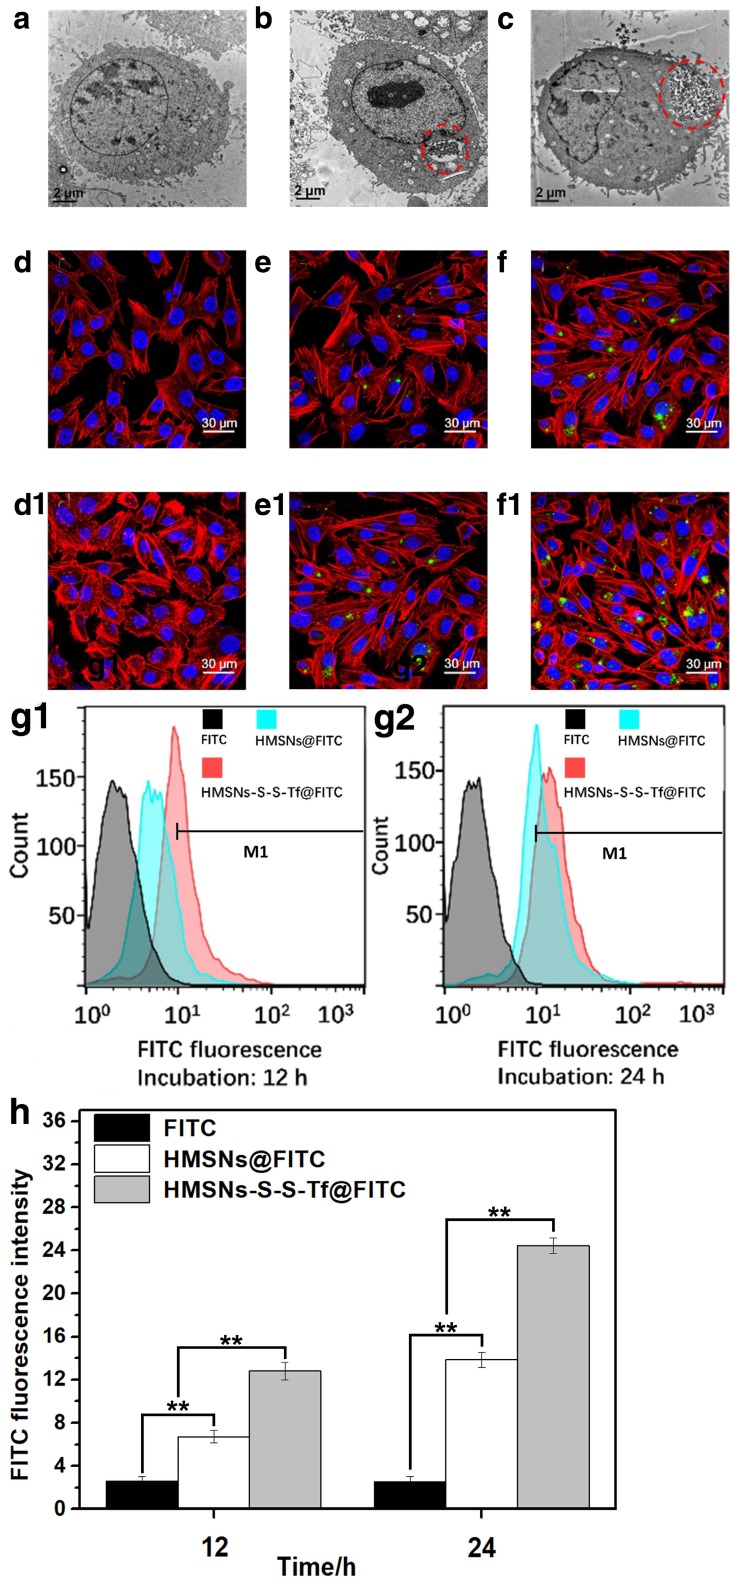
Figure 3.
Representative TEM images showing a MDA-MB-231 cell grown on (a, control group) TCPS and those treated with (b) free HMSNs or (c) HMSNs-S-S-Tf after 12 h. Endocytosed nanoparticles were marked with red circles. Scale bar: 2 μm. Representative CLSM images showing the distributions of (d and d1) free FITC, (e and e1) HMSNs@FITC, and (f and f1) HMSNs-S-S-Tf@FITC within MDA-MB-231 cells after incubations of 12 h and 24 h, respectively. Scale bar: 50 μm. Red: cytoskeleton, blue: cell nuclei, green: FITC-loaded nanoparticles. Flow cytometric evaluation of the nanoparticle intake with or without Tf conjugation in panel (g1, 12h) and (g2, 24h), respectively. The results were compared quantitatively in panel (h). (n = 6, **p < 0.01)

