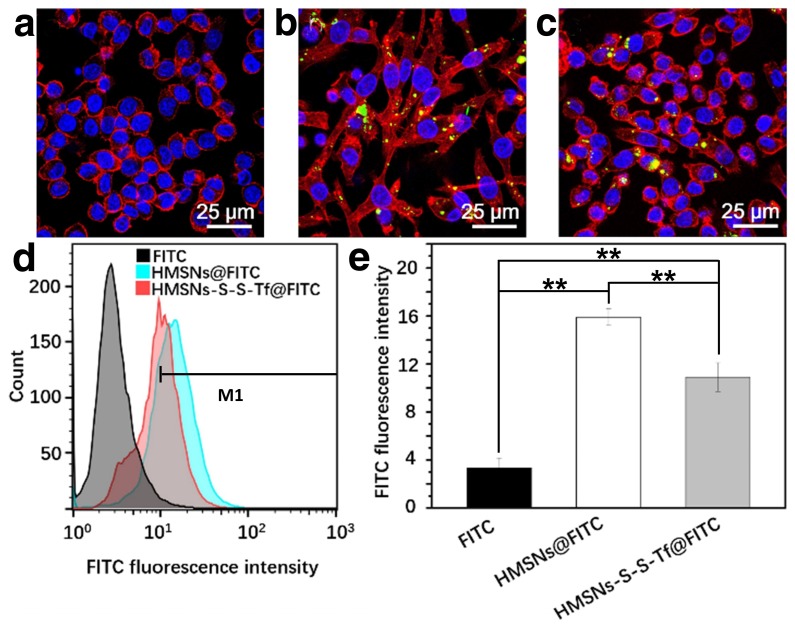
Figure 5.
Representative CLSM images showing RAW 264.7 macrophage cells treated with (a) free FITC, (b) HMSNs@FITC, and (c) HMSNs-S-S-Tf@FITC after 24 h. Scale bar: 25 μm. Red: cytoskeleton, blue: cell nuclei, green: FITC-loaded nanoparticles. (d) Nanoparticle intake as measured by flow cytometry. (e) Quantitative analysis of the flow cytometry data. (n = 6, **p < 0.01)

