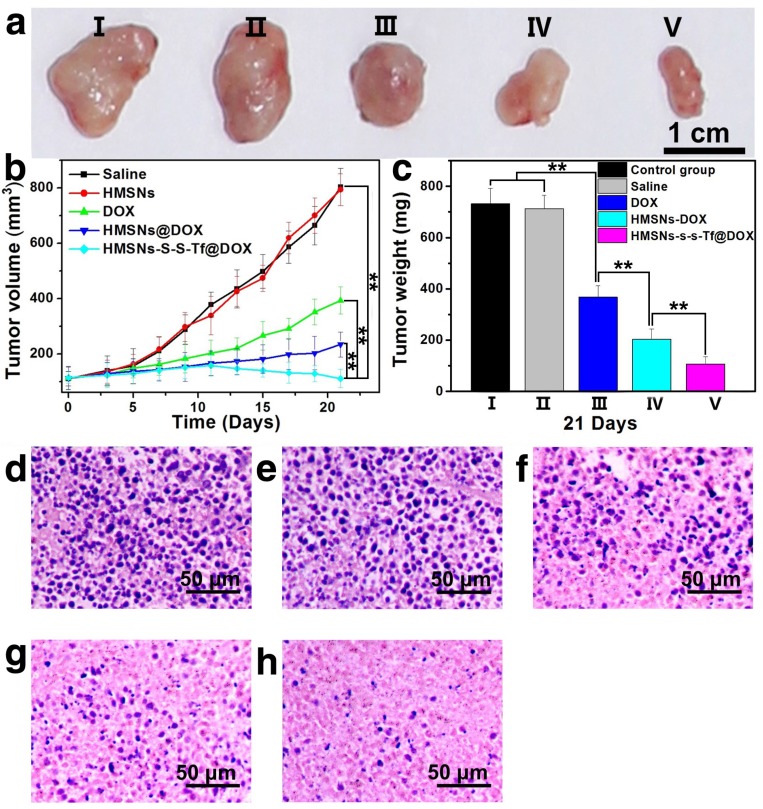
Figure 8.
(a) Representative morphologies of tumor tissues after being treated with saline (I, control group), HMSNs (II), DOX (III), HMSNs@DOX (IV), or HMSNs-S-S-Tf@DOX (V) for 21 days. (b) Continual measurements of tumor sizes by digital vernier calliper in vivo after the treatments. (c) Final weights of tumor tissues after treatment for 21 days. Histological observation of in situ apoptosis in tumor tissues by using the H&E staining method, after treatment with (d) saline, (e) HMSNs, (f) DOX, (g) HMSNs@DOX, or (h) HMSNs-S-S-Tf@DOX for 21 days, respectively. Blue: cell nuclei. (n = 6, **p < 0.01)

