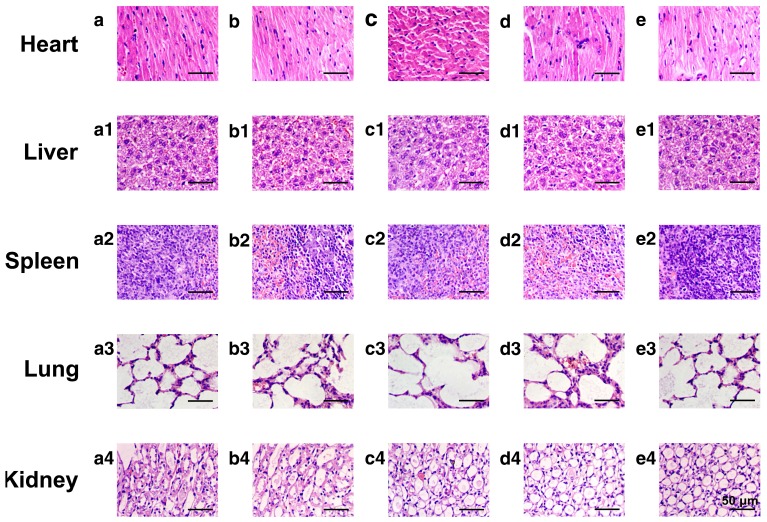
Figure 9.
Representative morphologies of vital organs after treatment with (a-a4) saline as a control group, (b-b4) HMSNs, (c-c4) DOX, (d-d4) HMSNs@DOX, or (e-e4) HMSNs-S-S-Tf@DOX for 21 days, respectively. Panel a-e: heart; Panel a1-e1: liver; Panel a2-e2: spleen; Panel a3-e3: lung; Panel a4-e4: kidney.

