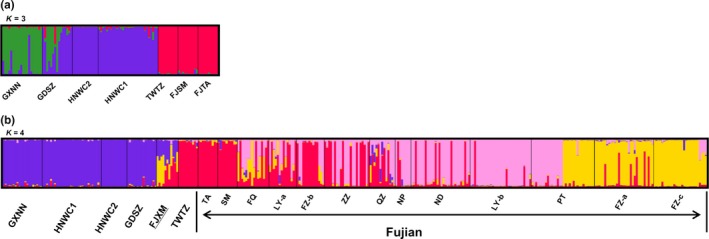
Figure 1.

Bar plot of population structure estimates of microsatellite data for Rhynchophorus ferrugineus samples in southern China. (a) Samples from new populations in this study; (b) Samples from new populations combined with those from Wang et al. (2015). Each individual is represented by a vertical line that is partitioned into various colored components. Clusters are separated by different colored bars
