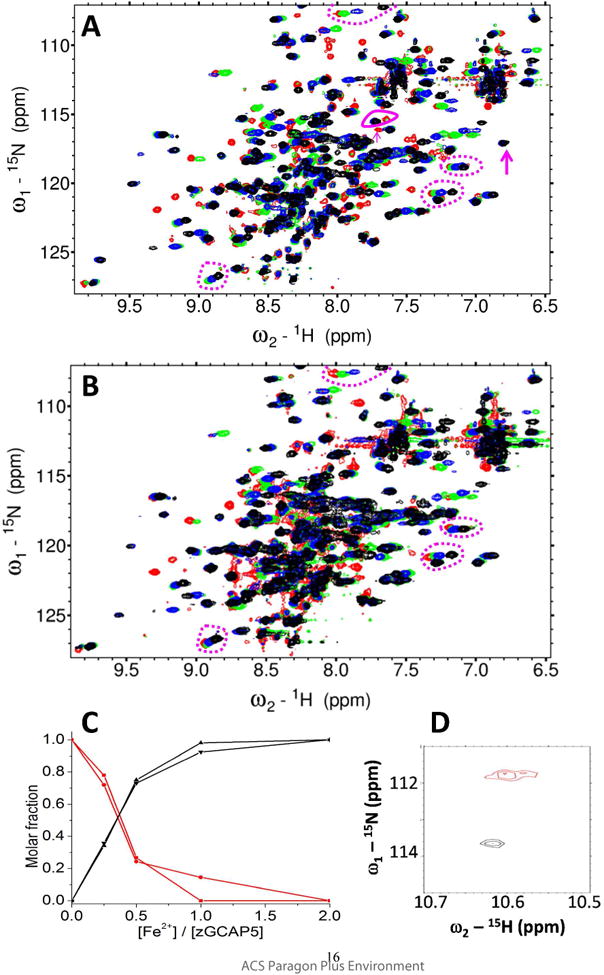
Figure 4. NMR titration of Fe2+ binding to GCAP5.

Overlay of 1H-15N HSQC spectra of 15N-labeled GCAP5WT (A) or GCAP5C15A/C17A (B) titrated with 0 (red), 0.50 (green), 1.0 (blue), and 3 (black) equivalents of Fe2+ ions. Peaks exhibiting slow exchange kinetics during the titration are marked by magenta arrows and solid circle in panel A, and are not present in the titration of GCAP5C15A/C17A (B). The slow exchange peaks at 7.6/115 and 7.7/116 ppm in the Fe2+-free GCAP5WT spectrum are tentatively assigned to Cys15 and Cys17 because these peaks are abolished in the spectrum of Fe2+-free GCAP5C15A/C17A. The slow exchange peaks at 7.7/115 and 6.8/117 ppm in the Fe2+-bound GCAP5WT spectrum are also assigned to Cys15 and Cys17 because these peaks are abolished in the spectrum of Fe2+-bound GCAP5C15A/C17A. Representative peaks exhibiting fast exchange kinetics are marked by the magenta dashed circles in panels A and B. (C) NMR intensity of the slow exchange peaks from Fe2+-free state (7.6/115 and 7.7/116 ppm, red) and Fe2+-bound state (7.7/115 and 6.8/117 ppm, black) are plotted as a function of Fe2+ concentration. (D) Expanded view of downfield region of HSQC spectrum of GCAP5C15A/C17A. The downfield peak at 10.60/111.8 ppm, assigned to Gly68 in EF2 in the Fe2+-free state (red), is shifted to 10.65/113.8 ppm in the Fe2+-bound state (black), suggesting that Fe2+ may bind to EF2.
