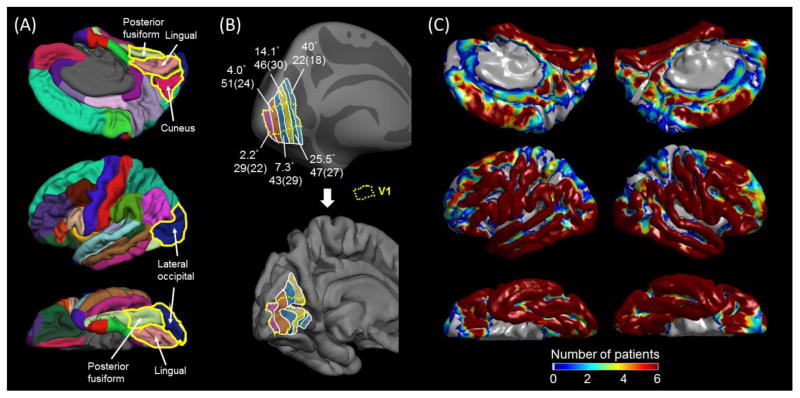
Figure 1. Regions of interest (ROIs), eccentricity estimates, and distribution of subdural electrodes.
(A) The medial-occipital cortex was defined to consist of the lingual (pink; below the calcarine sulcus) and cuneus regions (wine red; above the calcarine sulcus). The lateral occipital (blue) and posterior fusiform regions (light green) were defined as previously reported (Desikan et al., 2006; Nakai et al., 2017). (B) The inflated (upper) and pial (lower) images of the left hemisphere of the FreeSurfer averaged brain denote the medial-occipital regions with mean receptive-field eccentricity of 2.2, 4.1, 7.3, 14.1, 25.5, and 40.0° (Benson et al., 2012; Griffis et al., 2015). The boundary of striate cortex (V1; Hinds et al., 2008) in the medial-occipital surface is delineated with a broken line. The number of analyzed electrodes within a given eccentricity region for either hemisphere is indicated (along with number of contributing patients in parentheses). (C) The distribution of subdural electrodes, included in further analyses, is indicated at the whole-brain level. It should be noted that subdural disk electrodes inherently fail to sample ECoG activities generated by the deep cortex along the calcarine sulcus.

