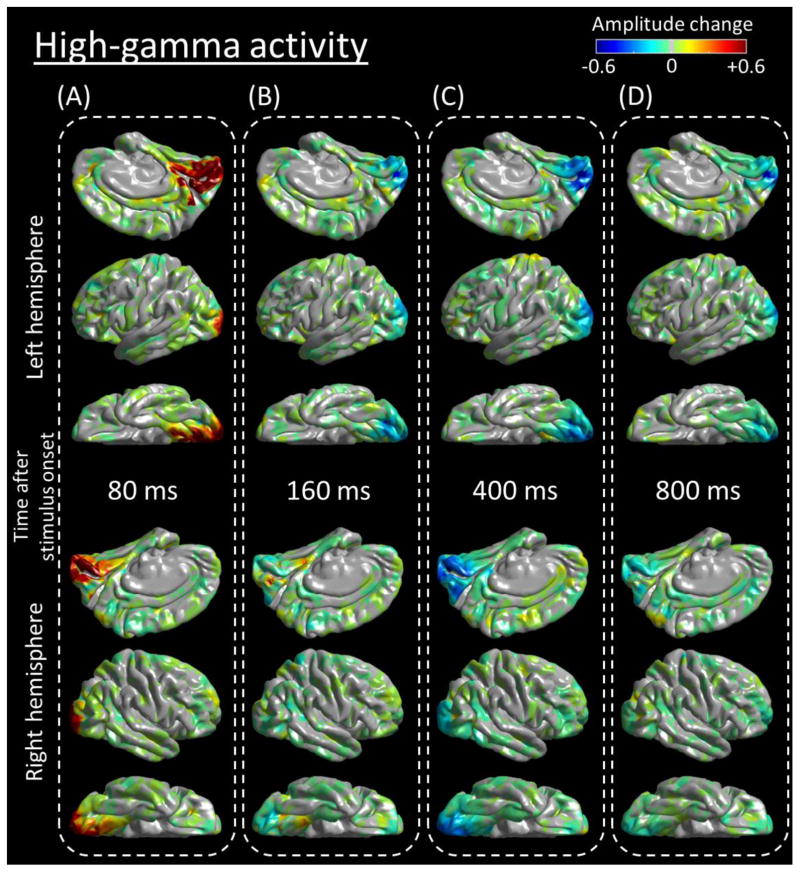
Figure 3. Snap shots of a 4D map of the human early visual system.
Flash-related amplitude augmentation is reflected by red, whereas attenuation by blue color (See also Video S1). ‘+0.6’ indicates that high-gamma amplitude70–110Hz was augmented by 60% compared to the average during the reference period at −200 to −100 ms relative to stimulus onset. Snapshots at (A) 80 ms, (B) 160 ms, (C) 400 ms, and (D) 800 ms.

