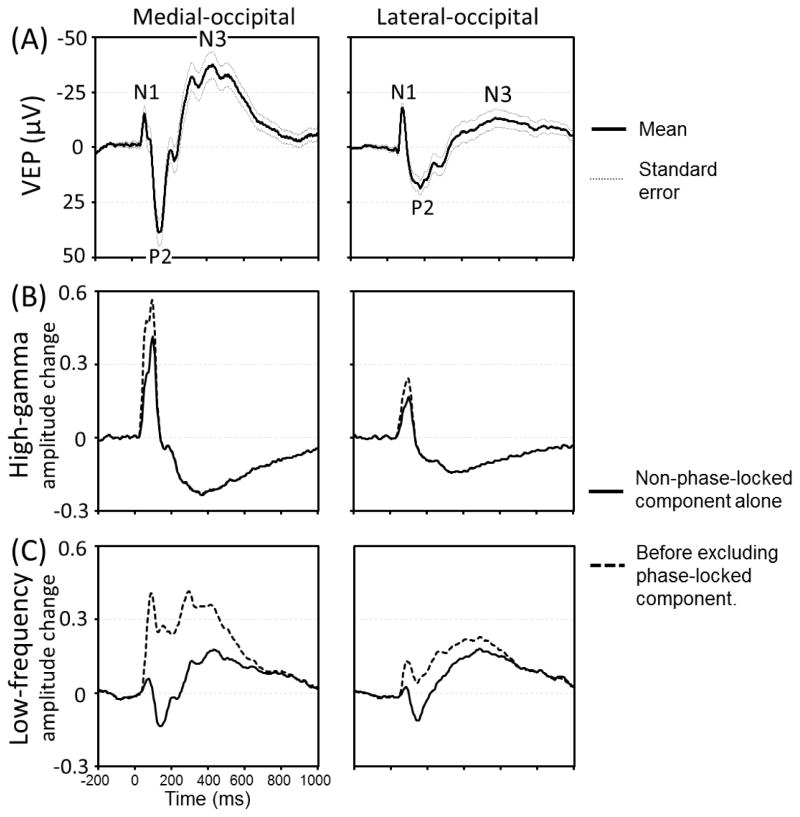
Figure 5. Visual-evoked potentials (VEPs), flash-related modulation of high-gamma and low-frequency band activity.
(A) Grand-averaged VEPs at the medial- and lateral-occipital regions are presented with standard errors. N1 peak latency was 64 and 79 ms, P2 latency was 142 and 176 ms, and N3 latency was 430 and 580 ms in the medial- and lateral-occipital regions, respectively. (B) The temporal changes of high-gamma amplitudes are presented. Solid line: non-phase-locked components alone. Dotted line: High-gamma amplitudes before excluding phase-locked components. The peak latency of non-phase-locked high-gamma augmentation was 95 and 100 ms, respectively. (C) The temporal changes of low-frequency band amplitudes.

