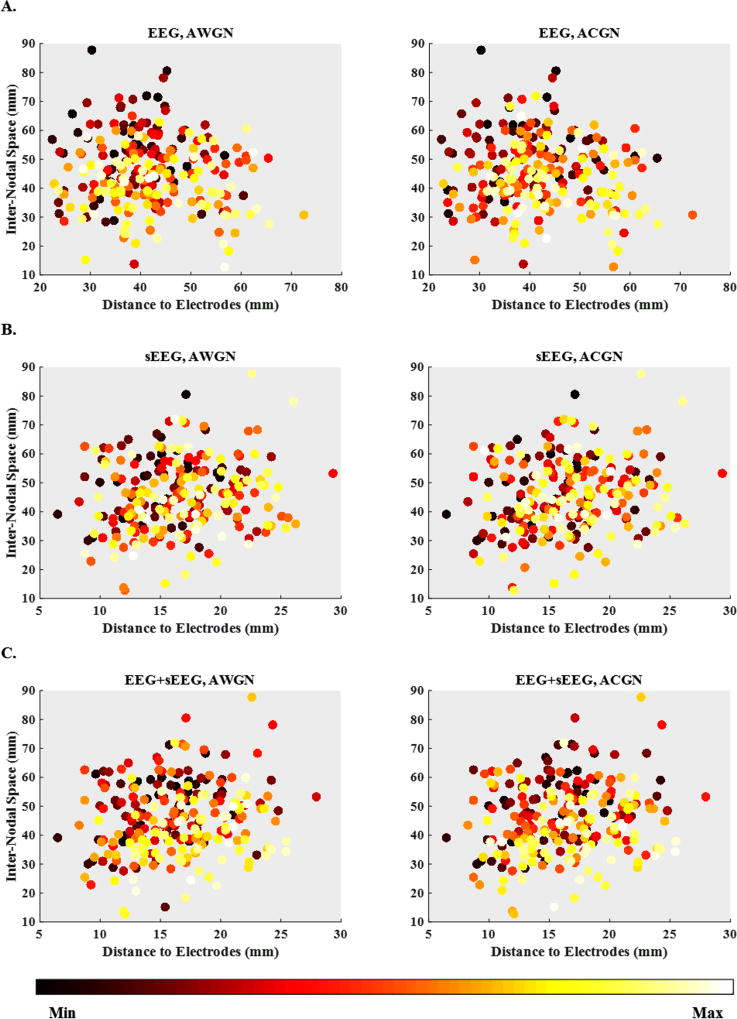
Figure 12. Connectivity error scatter plots.
Connectivity error scatter plots versus distance to electrodes and inter-nodal space for (A) EEG, (B) sEEG and (C) EEG+sEEG recording schemes under AWGN and ACGN noisy conditions. The horizontal axis and the vertical axis are respectively, the average distance to electrodes for every single node and the average inter-nodal space in the same source configuration. The connectivity errors, the third axis (not shown), are represented with colors.

