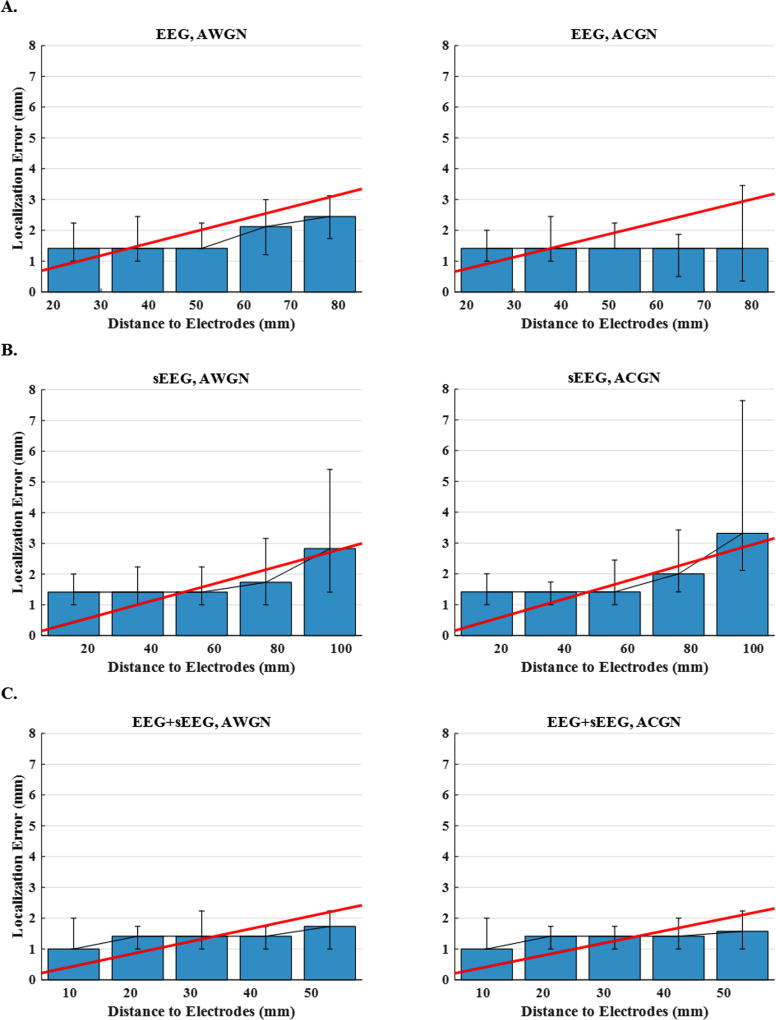
Figure 13. Localization error versus distance to sEEG electrodes for sources distributed over the entire brain.
The plots display the median localization errors over five ranges intervals (distance to the nearest electrode) for (A) EEG, (B) sEEG and (C) EEG+sEEG schemes and for AWGN and ACGN noise types. In order to make the trends more detectable, the scattered points are regressed with a line.

