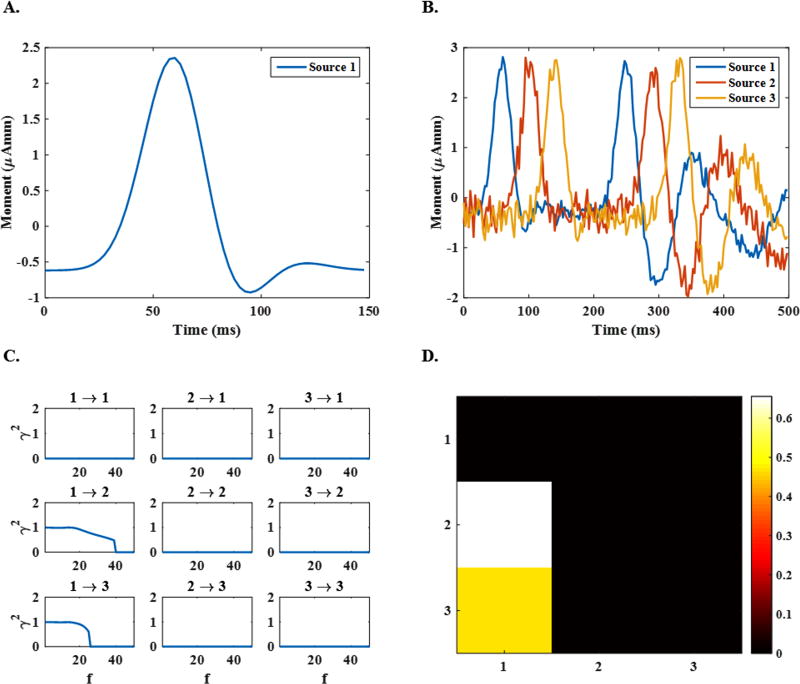
Figure 3. The configuration of the simulated networks.
(A) The time course assigned to the dipole in single-node sources, (B) the time courses assigned to dipoles in 3-node sources, (C) the connectivity links between nodes recovered by directed transfer function (DTF) at different frequencies in the range 1–50 Hz and (D) the recovered connectivity links averaged over all frequencies in the mentioned range.

