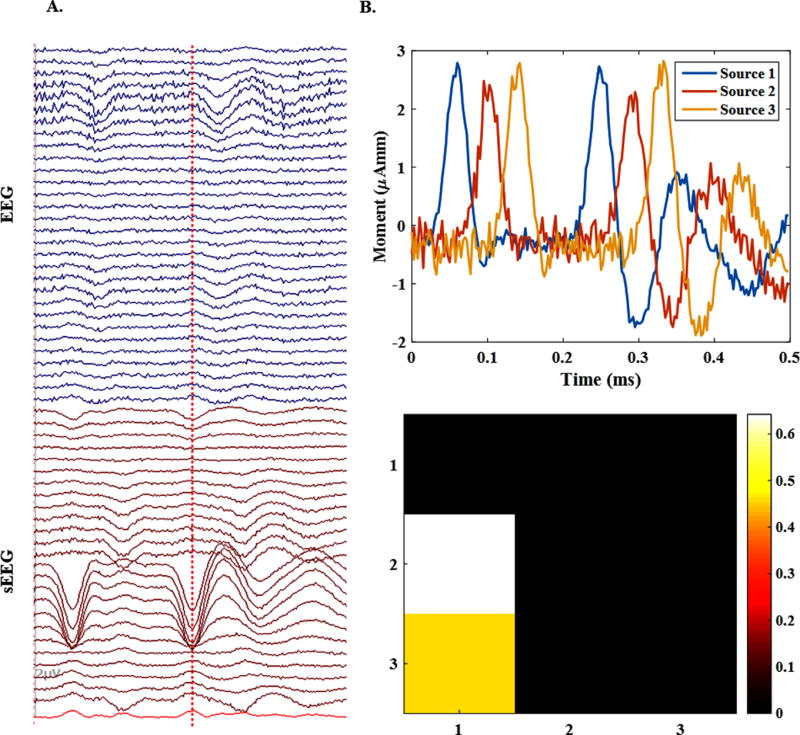
Figure 6. An example of a 3-node network.

(A) The simulated electrical potential recordings for a single 3-node source configuration in both EEG and sEEG setups. sEEG contains stronger spikes than EEG. (B) The accuracy of the source imaging for the same source using EEG+sEEG recordings. It can be seen that the time courses for each active node of the source are recovered precisely. Besides, the connectivity links are identified truly in the sense that source 1 is driving sources 2 and 3, as expected.
