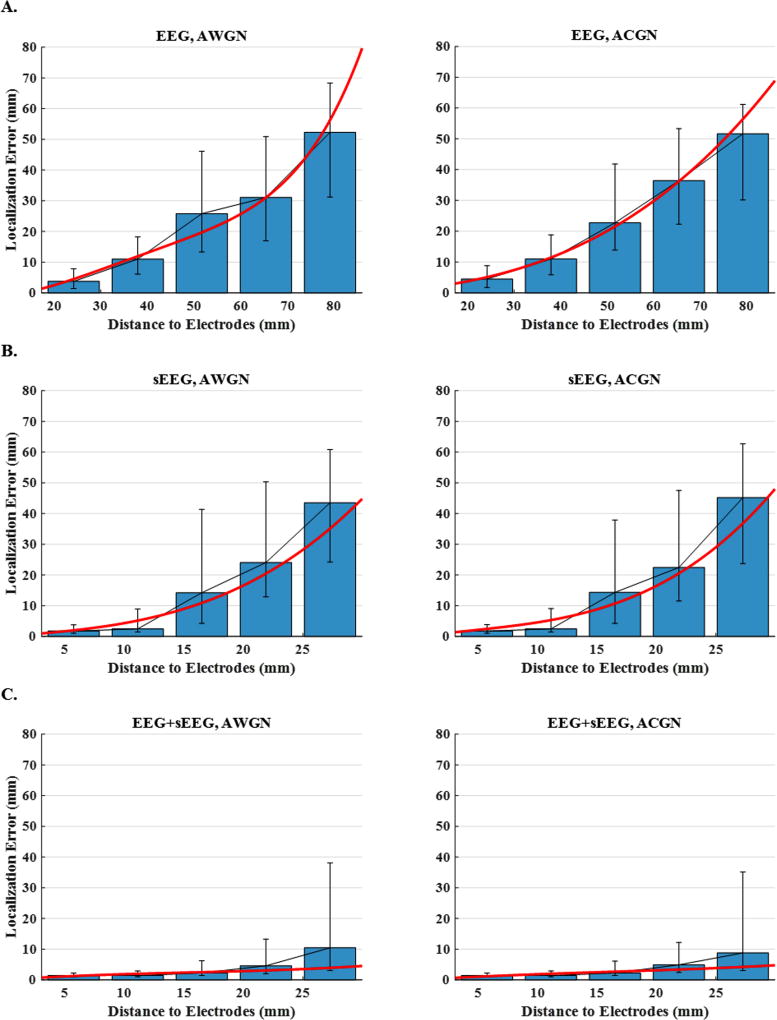
Figure 8. Localization error versus distance to electrodes for 3-node network configurations.
The plots display the median localization errors over five intervals (distance to the nearest electrode) for (A) EEG, (B) sEEG and (C) EEG+sEEG schemes and for AWGN and ACGN noise types. In order to make the trends more detectable, the scattered points are regressed with a polynomial of a degree determined by cross validation.

