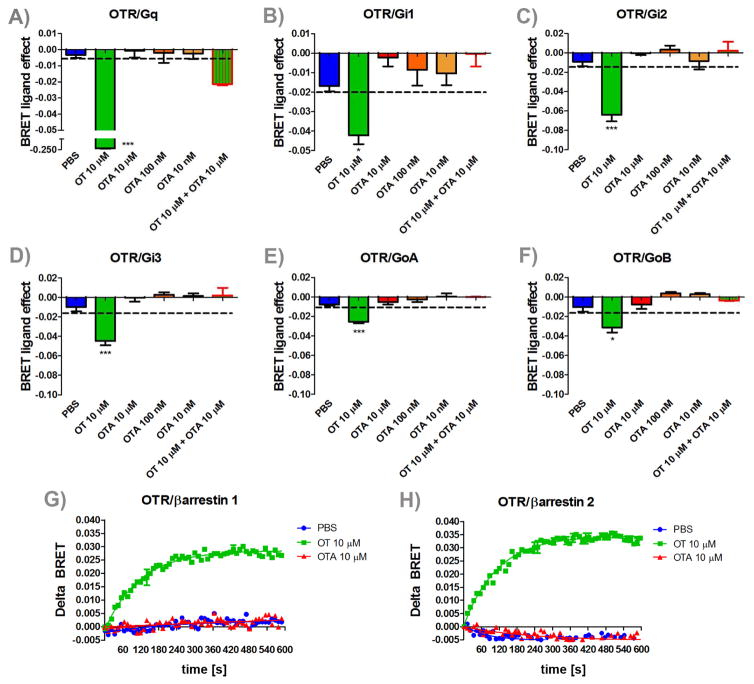
Figure 2. Effects of OTA on OTR activation of G-proteins and β-arrestins recruitment.
Mean and SEM of BRET ligand effect of OT, PBS, OT+ OTA and three different concentrations of OTA for (A) Gq, (B) Gi1, (C) Gi2, (D) Gi3, (E) GoA, and (F) GoB activation and (G) β-arrestin 1 and (H) β-arrestin 2 recruitment *=p < 0.05 effect of drug treatment vs. PBS, ***=p < 0.001 effect of drug treatment vs. PBS.

