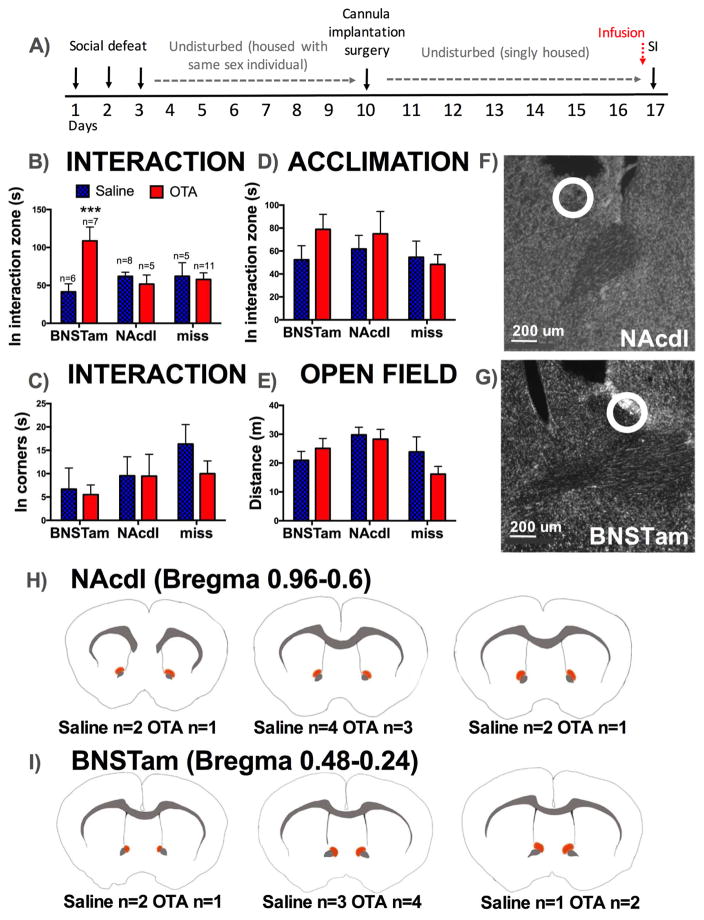
Figure 5. Effects of site-specific administration of OTA on behavior in stressed females.
Timeline of experiment (A). Mean and SEM time spent in the interaction zone (B) and in corners (C) during social interaction. There were no differences in time spent in the interaction zone during acclimation (D) or in locomotor behavior during open field phase (E). Example of hits in Nissl stained slices in NAcdl (F) and BNSTam (G) with injections sites indicated by circles. Diagrams showing location of injections considered as hits for NAcdl (H) and BNSTam (I). Under each diagram, the number of animals receiving injection in each site is indicated. ***=p < 0.01 effect of OTA vs. saline in animals receiving injections in BNSTam.

