
Fig. 1.
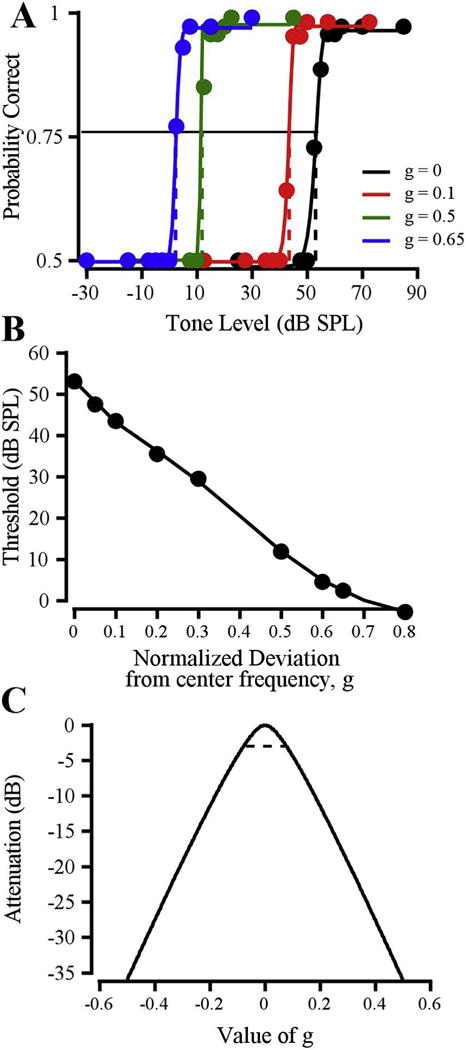
Estimation of an auditory filter shape from the notched-noise paradigm. A: Psychometric functions for detecting an 8-kHz tone in a 30 dB/Hz masker, with g values of 0 (black), 0.1 (red), 0.5 (green), and 0.65 (blue). Threshold is the signal level that would evoke 0.76 probability correct (indicated by dashed lines). B: Thresholds from (A) plotted as a function of g (normalized deviation from center frequency). C: Auditory filter shape for an 8-kHz tone in 30 dB/Hz noise (from data in B). Dashed line indicates the half power point of the filter; the bandwidth of the filter at the half-power point was taken as BW3dB. Data are from Monkey B. (For interpretation of the references to colour in this figure legend, the reader is referred to the web version of this article.)