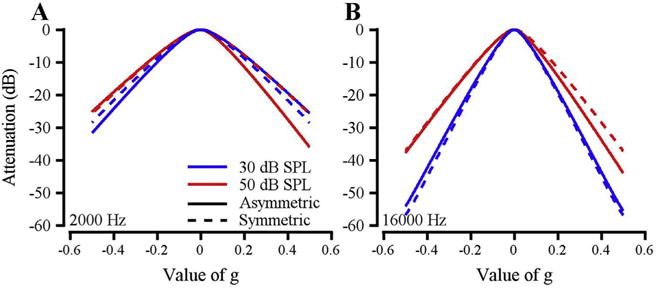
Fig. 4.

Auditory filter shape and asymmetry as a function of masker level. Data are from Monkey B. A: Symmetric (dashed lines) and asymmetric (solid lines) auditory filter shapes for a 2 kHz tone with 30 (blue) and 50 (red) dB/Hz maskers. B: Similar to A, but for a 16 kHz tone. (For interpretation of the references to colour in this figure legend, the reader is referred to the web version of this article.)
