
Fig. 7.
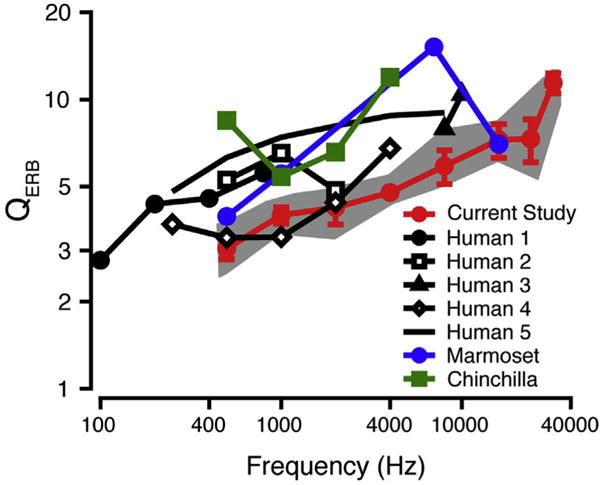
QERB as a function of frequency. Mean macaque behavioral QERB data (red circles; standard deviation error bars) are compared to behavioral QERB data for humans (black; filled circles (Human1): Moore et al., 1990; unfilled squares (Human2): Glasberg and Moore 1986; filled triangles (Human3): Shailer et al., 1990; unfilled diamonds (Human4): Desloge et al., 2012; solid line (Human5): Shera et al., 2002), marmosets (blue; Osmanski et al., 2013), and chinchillas (green; Niemiec et al., 1992). The gray shaded area shows the range of the macaque QERB values in the current study. (For interpretation of the references to colour in this figure legend, the reader is referred to the web version of this article.)