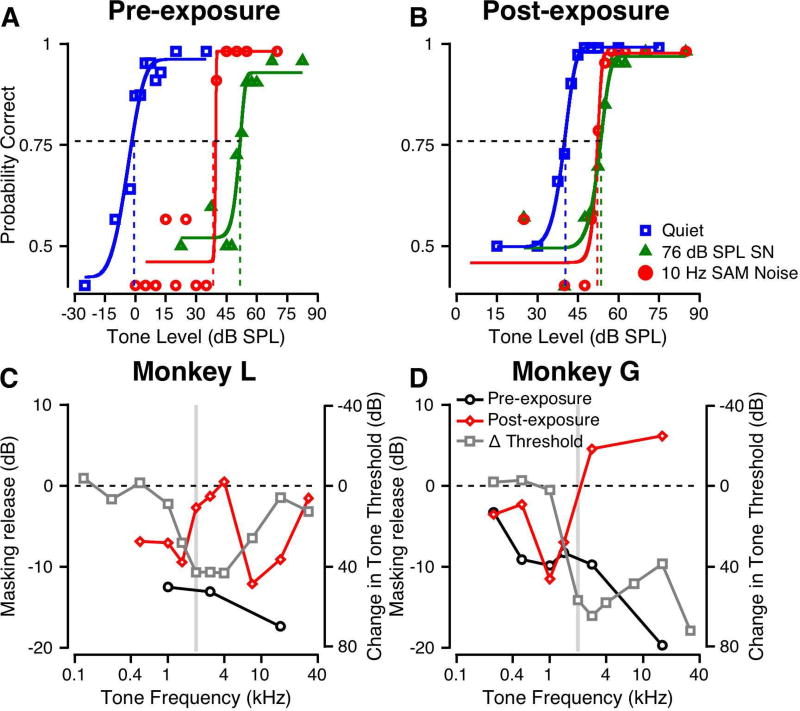
Figure 7.
Effect of 10 Hz modulated noise on tone detection before and after noise exposure. A: Psychometric function for a 2.828 kHz tone in quiet (blue), in continuous 76 dB SPL broadband SN (green) and in 76 dB SPL broadband noise sinusoidally amplitude modulated (SAM) at 10 Hz (red). Format is similar to that of Figure 5A. B: Similar to A, but obtained post-exposure. C: Threshold change for detection of a tone in 10 Hz SAM noise relative to threshold in SN. Δ = Threshold in SAM Noise – Threshold in SN. The grey bar shows the exposure frequency range. The dashed horizontal line represents equal thresholds for SN and SAM noise. Data are shown for Monkey L. Overlaid on these is the change in audiometric thresholds as a consequence of noise exposure (grey squares and line). D: Same as C, but for Monkey G.

