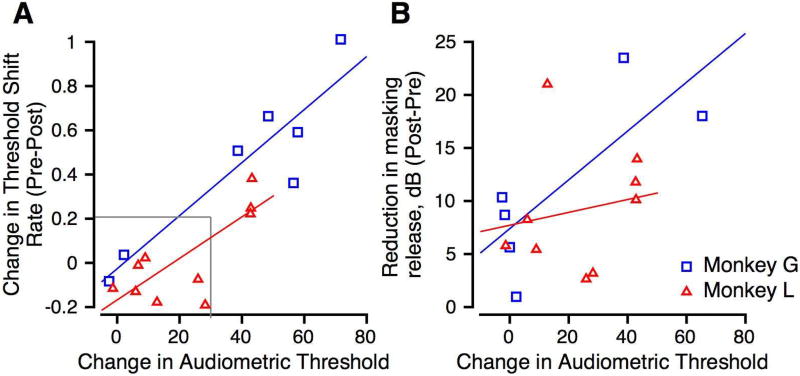
Figure 8.
A: Scatter plot of change in threshold shift rate vs. change in the audiometric threshold. Data from Monkeys G and L are shown in blue and red, respectively. Correlation coefficients were 0.515 (Monkey L) and 0.738 (Monkey G). Linear regressions are shown in blue and red for the data from Monkeys G and L, respectively. B: Scatter plot of reduction in masking release against change in the audiometric threshold. Format is similar to A. Correlation coefficients for individual subjects were 0.333 (Monkey L) and 0.371 (Monkey G).

