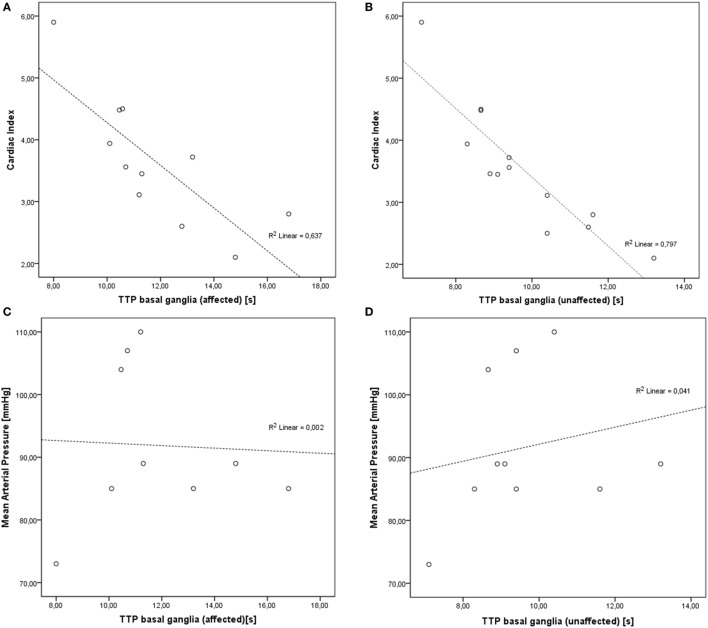
Figure 1.
Correlations of cardiac index (CI) and mean arterial pressure (MAP) levels and time-to-peak (TTP) values. (A) Inverse correlation of CI and TTP in affected basal ganglia (r = −0.798, p < 0.001). (B) Inverse correlation of CI and TTP in unaffected basal ganglia (r = −0.893, p < 0.0001). (C) No significant correlation of MAP and affected basal ganglia (r = −0.044, p = 0.911). (D) No significant correlation of MAP and unaffected basal ganglia (r = 0.202, p = 0.575).

