Figure 4.

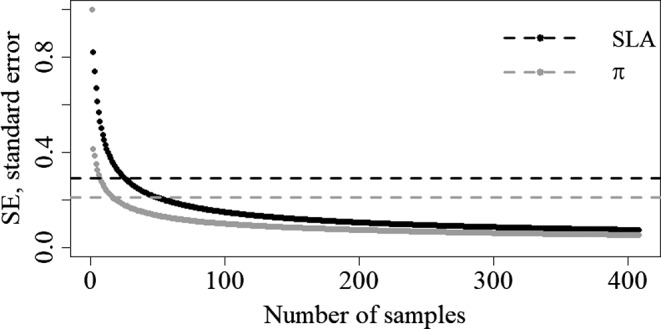
Relationship between number of samples considered and associated standard error (SE) of SLA (black points) and π (gray points)

Relationship between number of samples considered and associated standard error (SE) of SLA (black points) and π (gray points)