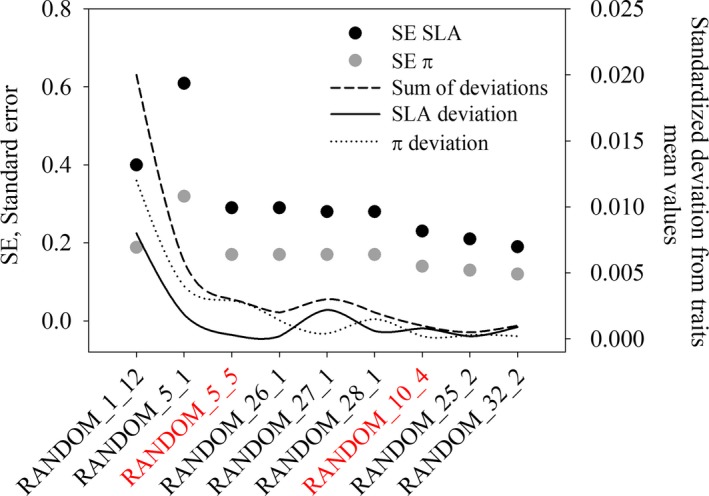
Figure 6.

Standard error (SE) and deviations from mean values of specific leaf area (SLA, mm2/mg) and for osmotic potential (π, ‐MPa) in different sampling size of RANDOM sampling strategy. Sampling sizes in red represent the minimum (RANDOM_5_5) and optimal (RANDOM_10_4) sampling sizes to estimate SLA and π with desired precision and accuracy
