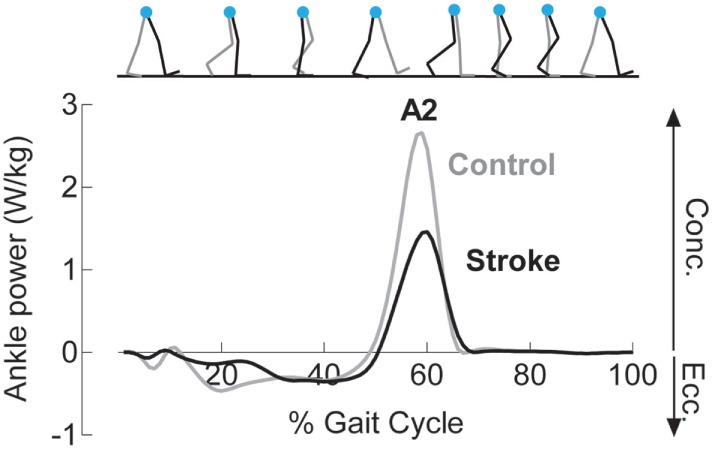
Figure 2.

Reduced concentric ankle plantarflexor power is noted following stroke. Example ankle power curves, derived from inverse dynamics, for a healthy control (gray) and an individual following stroke (black) demonstrate diminished peak concentric plantarflexor power (A2) late in the stance phase of gait.
