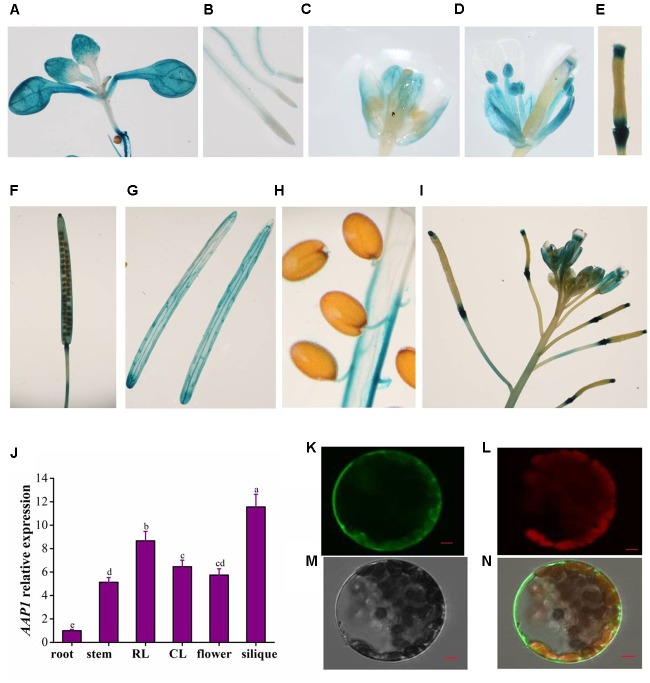
FIGURE 3.
Tissue-specific expression profile of AAP1 and subcellular localization of AAP1. Histochemical staining of GUS activity directed by the AAP1 promoter observed in the (A) cotyledons and true leaves and (B) the root vascular cylinder of 12-day-old seedlings. GUS activity observed in (C) flower buds, (D) open flowers, (E) young siliques, (F) developing siliques, (G) envelope of mature siliques, (H) seed pedicels, and (I) silique stalks at the top of the main stem in mature Arabidopsis plants. (J) AAP1 transcript level in different organs of mature wild-type (Col) plants. (K) AAP1-GFP fluorescence in protoplasts. (L) Chlorophyll auto-fluorescence. (M) Bright field. (N) Merged image. Bars = 5 μm. Experiments were repeated a minimum of three times with similar results. The values are means ± standard error (n = 3). Different letters above columns indicate significant difference (P < 0.05, Duncan’s multiple range test).

