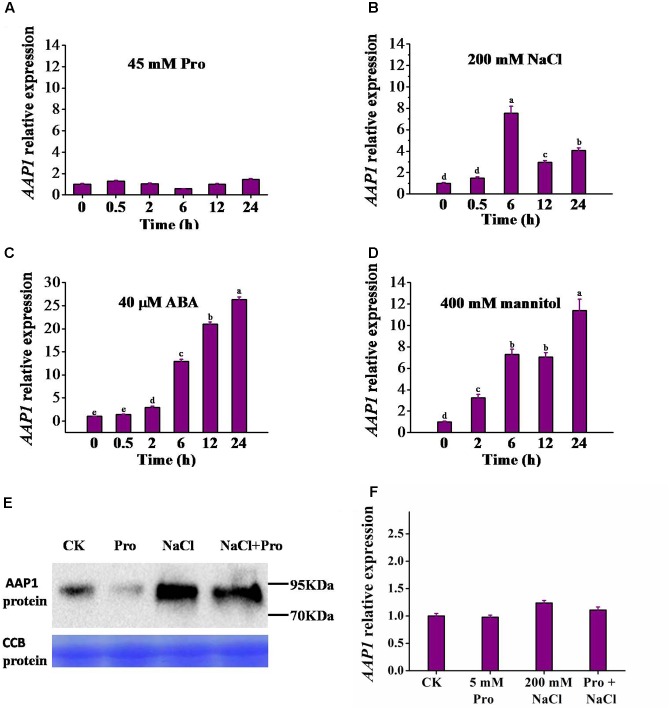
FIGURE 4.
Induction of AAP1 transcript and AAP1 protein level by different treatments. AAP1 relative expression level analyzed using real-time RT-PCR in 12-day-old wild-type (Col) seedlings following treatment for different time periods with 0.5× MS liquid medium containing (A) 45 mM L-proline (Pro), (B) 200 mM NaCl, (C) 40 μM abscisic acid (ABA), or (D) 400 mM mannitol. (E) AAP1-GFP protein level in 35S-PRE1:GFP seedlings following a 10-h treatment with various compounds. (F) AAP1 relative expression level in 35S-PRE1:GFP seedlings following a 7 h treatment with 5 mM Pro, 200 mM NaCl, or 5 mM Pro and 200 mM NaCl. 35S-PRE1:GFP, pre1-1 transformed PRE1 cDNA fused with GFP driven by the 35S promoter. Experiments were repeated a minimum of three times with similar results and data are means ± standard error (n = 3). Different letters above columns indicate significant difference (P < 0.05, Duncan’s multiple range test).

