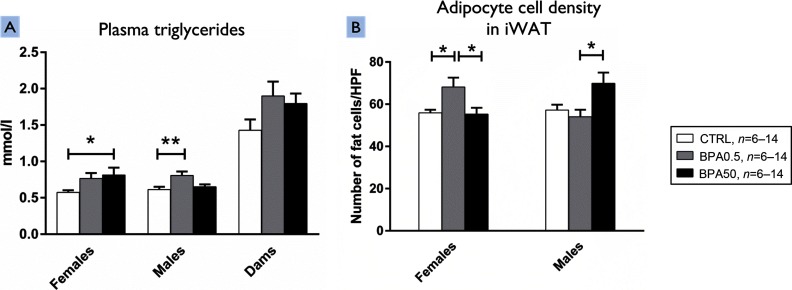
Figure 1.
Plasma triglyceride levels and adipocyte density in iWAT of female and male F344 offspring following developmental bisphenol A (BPA) exposure. Effects of developmental exposure to 0.5 (BPA0.5), 50 (BPA50), or ; BPA0.5, BPA50, CTRL on (A) plasma triglyceride levels (mmol/L) in five-wk-old female and male F344 offspring and dams (females, : CTRL, ; BPA0.5, ; BPA50, ); the Kruskal–Wallis test was used to calculate the difference between groups and p-values from Dunnett's test are shown in the figure (males, : CTRL, ; BPA0.5, ; BPA50, ); analysis of variance (ANOVA)/Dunnett’s test was used to calculate the difference between groups and p-values from Dunnett's test are shown in the figure. (B) Average number of iWAT fat cells per high power field in female and male F344 offspring [postnatal day (PND)35] (females, CTRL, ; BPA0.5, ; BPA50, ; males, ; CTRL, ; BPA0.5, ; BPA50, ), ANOVA/Dunnett’s test was used to calculate the difference between groups. Values are shown as the . Note: F344, Fischer 344 rat; iWAT, inguinal white adipose tissue. * ** .

