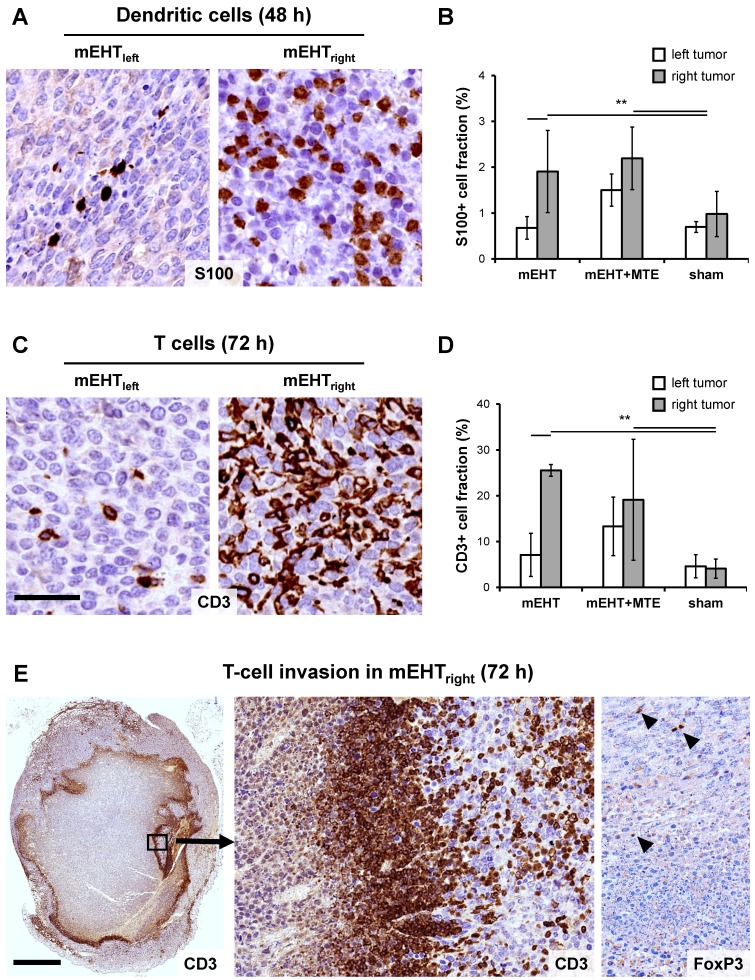
Figure 5.
mEHT induced tumor infiltration by immune cells. Significantly elevated numbers of S100 positive (brown) antigen presenting dendritic cells (APC) in the mEHTright tumors, and in both tumor sides of the mEHT+MTE combined group 48 h after treatment (A), as summarized in a graph (B). Increase in T-cell numbers also proved to be significant (p*<0.05) in the mEHTright tumors, and in both tumor sides of the mEHT+MTE combined group 72 h after treatment (C), shown also in a graph (D). Massive T-cell infiltration rim separates damaged central tumor regions from the intact periphery (E), which latter is also heavily infiltrated as seen at higher magnification (middle), with only scant FoxP3+ T cells (right). Scale bars in A-B and D-E: 40 µm. Scale bar in C-left: 2 mm, middle and right: 100 µm.

