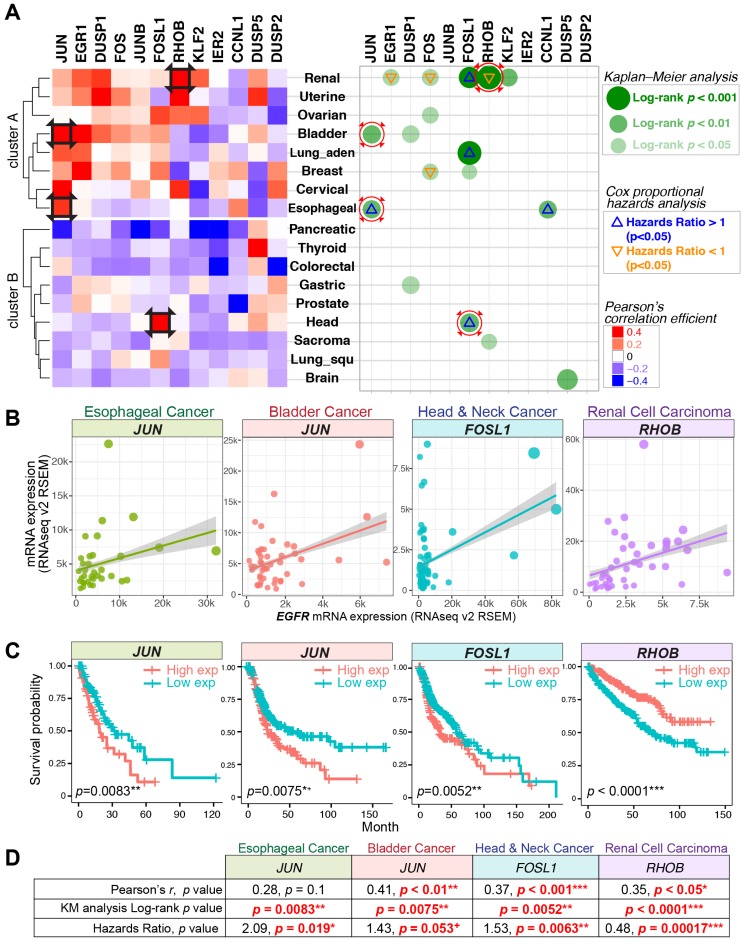
Figure 4.
Gene expression correlations, Kaplan-Meier (KM) curve, and Cox proportional hazards analyses across 17 TCGA datasets. (A) Left panel: Pearson's correlation coefficient for the expression of nEGFR target genes and EGFR across 17 cancer datasets. Red color indicates a positive correlation between the expression of IEG and EGFR. Right panel: KM and Cox regression analyses for the IEGs having positive Pearson's r. In the analyses, patients with high IEG expression (above average) was compared to those with low IEG expression (below average) for overall survival. Green dots indicate statistical significance (log-rank p < 0.05) in KM analysis. Triangle signs indicate statistical significance (p < 0.05) in multivariate Cox regression analysis (∇: hazards ratio <1, Δ: hazards ratio >1). A hazards ratio >1 indicates a higher risk of death when the IEG expression is higher. Black squares on the heatmap and red circles on the right panel indicate data taken for further visualization in Figure 4B/C/D. (B, C, and D) Gene expression correlation, KM curve, and Cox regression analyses for JUN, FOSL1, and RHOB in esophageal, bladder, head and neck, and renal cell carcinoma. + p = 0.05-0.06 (marginally significant); * p < 0.05; ** p < 0.01; *** p < 0.001.

