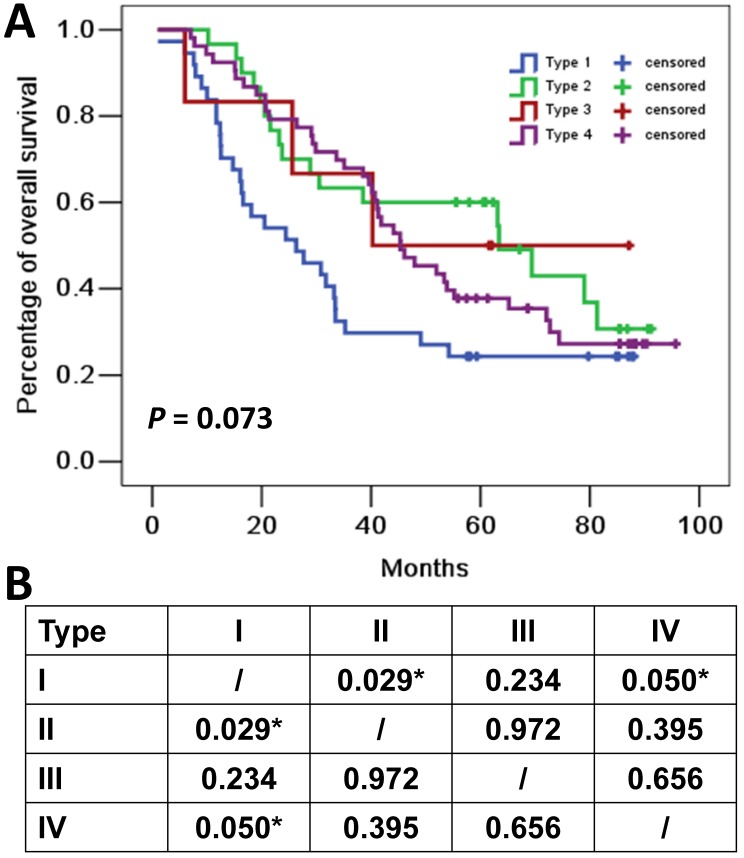
Figure 2.
Overall survival curves for four tumor microenvironment types based on programmed cell death ligand 1 (PD-L1) and tumor-infiltrating lymphocytes (TIL) status. (A) Kaplan-Meier curves for the four tumor microenvironment types. Tick marks represent censored data. (B) P values of pairwise over strata comparison between different groups. *P≤0.05.

